Volume Surprise
![]() By LuxAlgoOct 22, 2025
By LuxAlgoOct 22, 2025
The Volume Surprise trading indicator helps traders instantly identify unusual trading activity by comparing actual volume with its expected level at any given time. It visually displays both real and estimated volume directly on the chart, making it easy to detect spikes or drops in participation. This powerful volume-based trading tool also projects expected volume for upcoming bars, allowing traders to forecast future market activity with enhanced precision.
By analyzing how current volume diverges from what’s statistically expected, the Volume Surprise indicator helps confirm trend strength, detect potential reversals, and spot anomalies caused by events such as earnings announcements, news releases, or macroeconomic reports.
How to Trade with the Volume Surprise Trading Indicator
A “Volume Surprise” occurs when actual trading volume is significantly higher or lower than the expected value for that specific time. These deviations often signal that market participants are reacting unusually, providing early clues of trend acceleration or fading momentum.
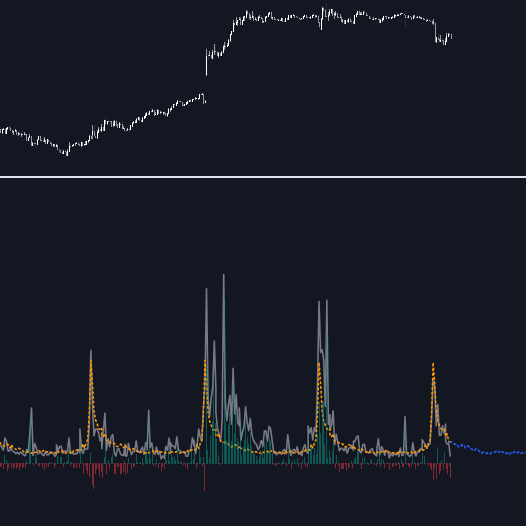
A built-in histogram displays the difference between actual and expected volume, helping traders visually measure deviations and even use the histogram itself as a standalone volume momentum indicator.
Traders can also use the tool to assess how impactful certain market events are. For example, if an important announcement generates lower-than-expected volume, it might indicate muted trader interest or that the market is underestimating the news. Conversely, a surge in volume beyond expectations often accompanies strong breakouts or panic-driven moves.
As shown above, significant deviations between actual and expected volume can highlight anomalies or imbalances that may lead to market corrections or short-term reversals.
Detecting Rare or Exceptional Trading Activity
The expected volume is calculated as the average (or median) of past volumes at a specific time. Users can customize how this expected value is computed by grouping volume across user-defined time periods such as hours, days, or months.
To emphasize extremely high or low volume events, traders can switch the calculation mode to Percentiles. By setting a percentile close to 100, you focus on unusually high-volume bars (e.g., 95th percentile), while setting it near 0 highlights exceptionally low-volume conditions.
In this example, the 95th percentile highlights only periods where the trading volume exceeds 95% of all historical volumes recorded at that specific time, isolating the most impactful and rare market activity.
Technical Details and Configuration
Choosing the Right Periods
The accuracy of expected volume depends on how volume is grouped. For example, when grouping by hour, the indicator compares today’s 7 PM volume to historical 7 PM volumes to calculate an accurate expected value.
You can also combine multiple time periods (e.g., hours and weekdays) to refine the grouping and improve precision. However, enabling too many periods can dilute the sample size, reducing reliability. For simplicity, an Auto Selection mode automatically picks optimal periods based on your current chart timeframe.
Group Length and Historical Data Depth
The Length setting controls how many past observations are included in each group. Increasing this value extends the historical window, making expected volumes more stable and uncovering recurring seasonal or intraday patterns in trading activity.
Recommended Assets and Markets
This indicator performs best on assets with strong cyclical trading patterns such as stocks, futures, and forex pairs, which typically show predictable activity spikes during specific sessions or calendar periods.
In contrast, cryptocurrencies—which trade 24/7—tend to show weaker periodicity, reducing the accuracy of volume forecasts and expected value comparisons. While still useful, crypto traders should interpret the indicator’s output more cautiously.
Settings Overview
General
- Length: Maximum number of historical samples used per time group.
- Smooth: Simple moving average period applied to smooth out the expected value.
Periods
- Auto Selection: Automatically chooses optimal period combinations based on timeframe.
- Manual Periods: When disabled, users can manually select:
- Minutes
- Hours
- Days (Day of Week, Day of Month, Day of Year)
- Months
- Quarters
Summary
- Method: Defines how expected value is calculated — options include Mean (default) or Percentile.
- Percentile: Used when the method is set to Percentile (e.g., 95 for high-volume detection).
Forecast
- Forecast Window: Number of future bars to project expected volume for.
- Style: Adjusts how the forecast is visually represented on the chart.
FAQ
What is the Volume Surprise indicator?
It’s a trading indicator that compares actual and expected volume to reveal when trading activity is unusually high or low, signaling potential opportunities.
How can I use it in my trading strategy?
Use it to confirm breakouts, detect fading moves, or anticipate reactions to economic events. High surprises often precede trend continuations, while low surprises can suggest weakening interest.
Which assets work best with this indicator?
Assets with regular trading cycles—such as stocks, futures, and forex pairs—yield the most reliable expected volume estimates.
How can I access the Volume Surprise indicator?
You can get access on the LuxAlgo Library for charting platforms like TradingView, MetaTrader (MT4/MT5), and NinjaTrader for free.
Free indicator
Get free access to this indicator on the platforms below.
Unlock the entire LuxAlgo Library
Every indicator, every strategy, full charts, and complete access to Quant — our AI agent.