Volumetric Order Flow Structure
 By LuxAlgoFeb 16, 2026
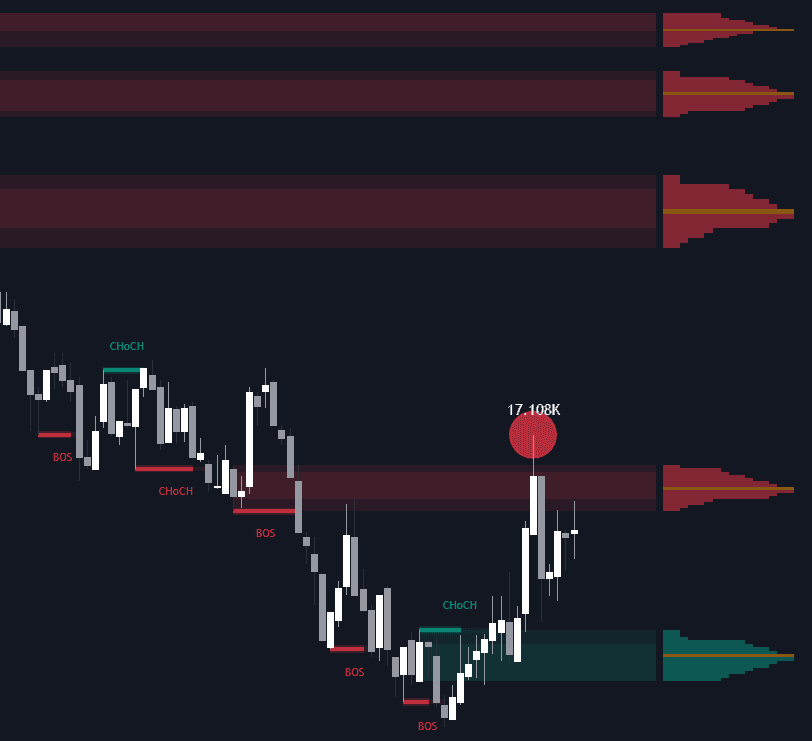
The Volumetric Order Flow Structure indicator is an advanced trading indicator built to help traders understand true market structure using real volume distribution and institutional order flow concepts. By combining Break of Structure (BOS), Change of Character (CHoCH), stepped volume profiles, and liquidity raid detection, this tool delivers a complete trading strategy framework for identifying high-probability supply and demand zones backed by real transactional data.
Unlike traditional structure indicators that rely solely on swing highs and lows, this indicator integrates volumetric confirmation, volume delta pressure, and Point of Control (POC) analysis to help traders distinguish between high-conviction breakouts and low-volume fakeouts.
How to Trade the Volumetric Order Flow Structure Indicator
This trading indicator is designed to help you align with institutional activity rather than retail noise. It provides multiple layers of confirmation to build a structured trading strategy around supply and demand dynamics.
Traders can use this tool to identify:
- High-conviction breakouts versus low-volume fakeouts.
- Precise price levels within a zone where the most volume was transacted (POC).
- Liquidity raids that suggest a potential reversal or trend continuation.
- Institutional accumulation and distribution footprints inside structure breaks.
The glowing structure bars provide instant visual confirmation of breakout strength, while manipulation bubbles highlight potential traps where smart money may be triggering stops before reversing price.
Volumetric Market Structure (BOS & CHoCH Confirmation)
The script automatically detects:
- Break of Structure (BOS) – Continuation signals within a trend.
- Change of Character (CHoCH) – Early warnings of potential trend reversals.
When a breakout occurs, the indicator plots glowing "Volumetric Bars" that expand horizontally based on the breakout candle’s volume delta. This means the width of the bar visually represents the internal buying or selling pressure behind the move.
This transforms classic price structure analysis into a volume-backed trading strategy, allowing you to:
- Confirm whether a breakout is supported by aggressive buyers or sellers.
- Avoid weak structure breaks with low participation.
- Enter trends with higher conviction.
Stepped Volume Profiles Inside Order Blocks
Each active Order Block includes a detailed 15-row horizontal volume histogram, forming a stepped volume profile directly inside the zone.
The script calculates the internal volume distribution of the pivot candle and highlights the Point of Control (POC) in orange. The POC represents the price level where the highest amount of volume was traded within that zone.
This allows traders to:
- Pinpoint the exact institutional price node within supply or demand.
- Refine entries around high-volume clusters.
- Identify areas of maximum liquidity concentration.
- Build precise stop placement strategies.
Instead of treating supply and demand zones as broad rectangles, this trading indicator helps you trade the exact internal price levels where real positioning occurred.
Manipulation Bubbles (Liquidity Raids & Stop Hunts)
One of the most powerful features of this indicator is the Manipulation Bubbles system.
These circular markers appear when price wicks beyond a supply or demand zone but fails to close through it. This often signals a liquidity raid — a move designed to trigger stop-loss orders before reversing.
Each bubble:
- Is dynamically sized based on relative volume.
- Includes external volume data labels.
- Highlights potential institutional trapping behavior.
This makes it easier to identify:
- Stop hunts.
- False breakouts.
- Trap-and-reverse scenarios.
- Continuation after engineered liquidity grabs.
For traders focused on smart money concepts and order flow trading, this feature provides an actionable edge.
Advanced Zone Management & Smart Filtering
The indicator uses a dynamic zone management system where supply and demand zones automatically extend across the chart until price closes decisively beyond them.
To maintain clarity, an advanced Hide Overlapping filter ensures that when multiple zones form within the same price range, only the most relevant (highest volume) block remains visible.
This prevents chart clutter and keeps your trading strategy focused on the most important institutional levels.
Additionally, ATR-based scaling ensures:
- Zone thickness remains proportional across assets.
- Labels scale properly whether trading Forex, Stocks, Indices, or Crypto.
- Visual consistency across low- and high-priced instruments.
This makes the indicator highly adaptable for multi-asset traders.
Indicator Settings Explained
Detection Settings
- Pivot Length: Defines the lookback period used to detect structural highs and lows. Larger values identify major structure; smaller values capture intraday shifts.
- Volume Lookback: Sets the calculation window for relative volume scaling and breakout sensitivity.
Visual Settings
- Max Recent Blocks: Controls how many active supply and demand zones remain visible.
- Base Transparency: Adjusts the opacity of volumetric zones for better chart integration.
- Hide Overlapping Blocks: Removes smaller, lower-volume zones nested inside stronger ones.
Manipulation Settings
- Show Manipulation Bubbles: Enables or disables liquidity raid markers.
- Size Sensitivity: Adjusts how aggressively bubble size reacts to volume spikes.
Why Use Volumetric Order Flow Structure in Your Trading Strategy?
This trading indicator bridges the gap between classic market structure analysis and institutional order flow.
It helps traders:
- Trade with volume confirmation instead of pure price action.
- Identify real supply and demand zones backed by data.
- Avoid fake breakouts.
- Detect stop hunts and liquidity sweeps.
- Improve entry precision and risk management.
Whether you trade Forex, Stocks, Futures, or Cryptocurrencies, this tool provides a structured, volume-backed framework for analyzing market behavior.
FAQ
What is the Volumetric Order Flow Structure indicator?
It is a volume-based market structure trading indicator that combines BOS, CHoCH, stepped volume profiles, POC detection, and liquidity raid analysis into a unified trading strategy tool.
Is this indicator suitable for all markets?
Yes. The ATR-based scaling and dynamic zone system ensure consistent performance across Forex, Stocks, Indices, and Crypto markets.
How do manipulation bubbles help in trading?
They identify liquidity raids where price temporarily breaks a zone but fails to close beyond it, often signaling a reversal or continuation setup driven by institutional order flow.
How can I access the Volumetric Order Flow Structure indicator?
You can get access on the LuxAlgo Library for charting platforms like TradingView, MetaTrader (MT4/MT5), and NinjaTrader for free.
Free indicator
Get free access to this indicator on the platforms below.

Unlock the entire LuxAlgo Library
Every indicator, every strategy, full charts, and complete access to Quant — our AI agent.