Walk-forward Analysis
 By LuxAlgoJul 26, 2026
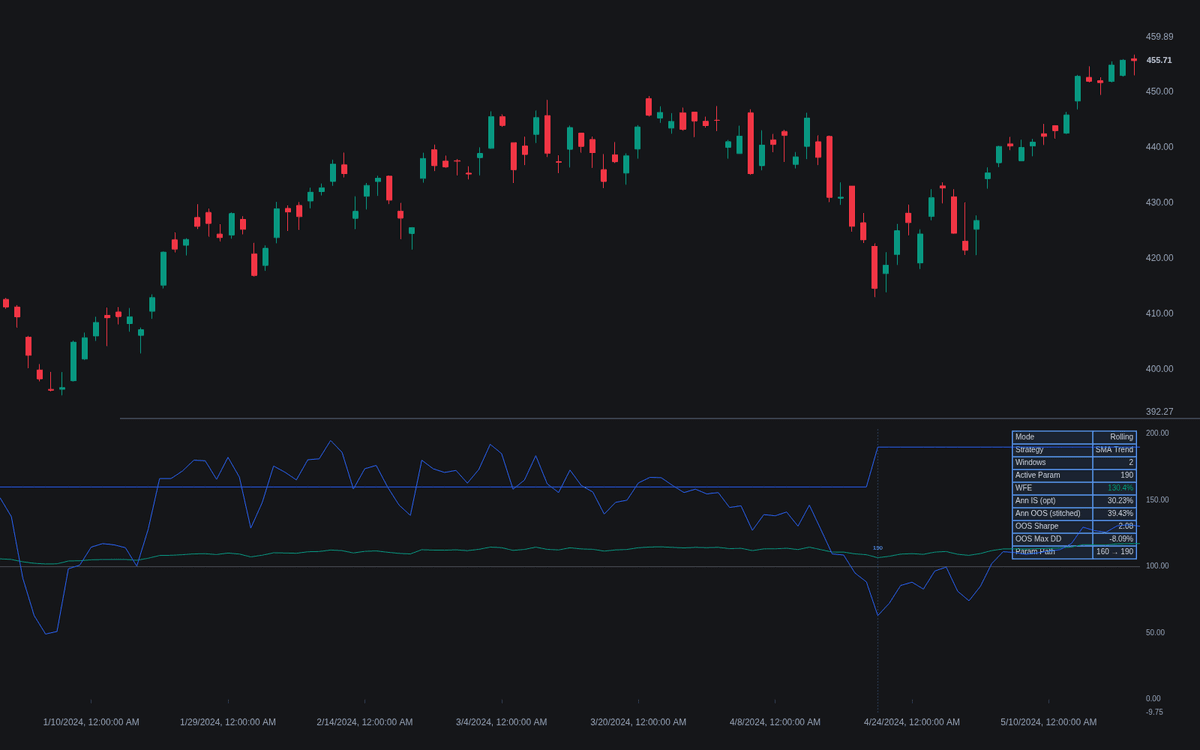
Walk-forward Analysis puts the validation protocol itself on the chart — the first faithful implementation of walk-forward analysis as a live indicator. Each in-sample window sweeps a built-in single-parameter strategy across its range, deploys the winner unchanged on the next unseen segment, and steps forward; the stitched out-of-sample equity plots around a base of 100, with each window separated and labeled.
How to Trade the Walk-forward Analysis?
- WFE: walk-forward efficiency is the annualized out-of-sample return rate over the in-sample rate; some degradation is expected, so roughly 0.5 and above is often treated as respectable.
- Param Path: the dashboard lists the last chosen parameters — wild window-to-window jumps mark an optimizer fitting noise.
- Threshold crossings: WFE crossing its threshold fires alerts both ways, alongside New Walk-Forward Window and Chosen Parameter Changed.
Treat it as one screen among the validation tools, not as a strategy in itself.
Walk-forward Analysis Settings
- Walk-Forward Mode (default Rolling): constant-length windows, or Anchored ones growing from the first bar.
- In-Sample Length (bars) (default 500) and Out-of-Sample Length (bars) (default 125): a 4:1 frame; 3:1 to 5:1 is common.
- Strategy (default SMA Trend) and Position Mode (default Long/Short): SMA/EMA Trend or Momentum; reverse or step flat.
- Parameter Minimum, Parameter Maximum and Parameter Step (defaults 10, 200, 10): the sweep, capped at 40 candidates.
- Optimization Objective (default Net Return): maximize net log return, or Return/Risk.
- WFE Threshold (default 0.5): the efficiency reference level.
- Show Dashboard (on) with Location (Top Right) and Size (Small); style toggles cover labels, separators and shading.
Frequently Asked Questions
How does walk-forward differ from purged cross-validation?
Purged Cross-Validation rotates which segments are held out and guards leakage with purge gaps; walk-forward optimizes only on the past and tests strictly forward. One rehearses live re-optimization, the other squeezes more evaluations from one sample.
Can it run my own strategy?
No — it sweeps the three built-in single-parameter strategies only. The point is the protocol: watching how re-optimization, WFE and the parameter path behave on your market with a strategy simple enough to audit.
What does the equity curve actually show?
Compounded log returns of every out-of-sample deployment stitched end to end, indexed to 100 and colored by side of the base — a record of the protocol under the current settings, not a forecast.

The Library is free. Quant makes it yours.
Pull any concept or indicator into Quant: rebuild it, retune it, or turn it into a backtested strategy of your own.