
Understand the Accumulation, Manipulation & Distribution trading strategy to align your trades with institutional market movements.
The Accumulation, Manipulation & Distribution (AMD) Trading Strategy helps traders identify market phases often influenced by large participants. Here's a quick breakdown:
- Accumulation Phase: Institutions quietly buy assets, leading to price consolidation in a narrow range.
- Manipulation Phase: Price moves are distorted to exploit retail traders through tactics like stop hunts and false breakouts.
- Distribution Phase: Institutions sell off assets, often marking the end of an uptrend.
Why It Matters
- Better Timing: Align trades with major flows and avoid common retail traps.
- Risk Management: Clear entry/exit rules reduce guesswork.
- Versatility: Works across indices, forex, commodities, and more.
Key Tools
- Volume-Price Analysis: Analyze volume patterns to confirm phase transitions.
- Chart Patterns: Use patterns like springs and upthrusts to spot shifts.
- LuxAlgo on TradingView: Automate phase detection with PAC Toolkit and Oscillator Matrix.
Mastering AMD can improve trade accuracy, reduce losses, and help you stay ahead of market traps. Ready to dive deeper? Let’s break it down phase by phase.
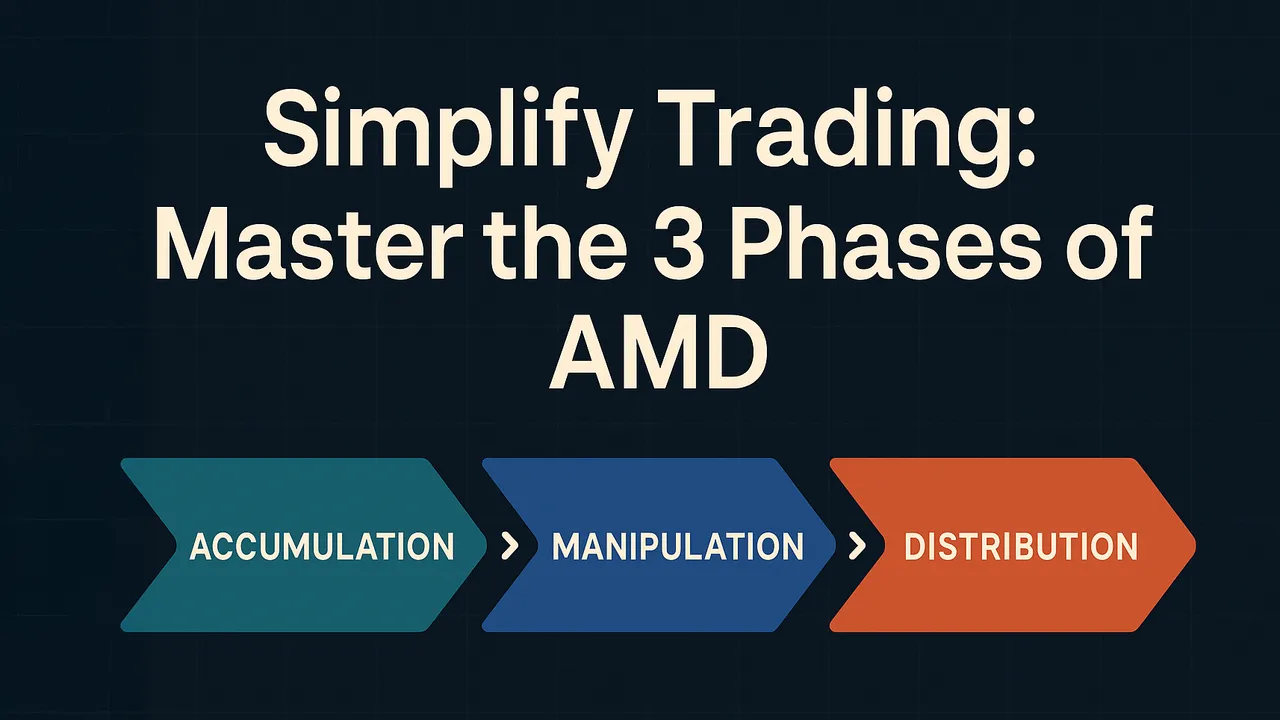
Simplify Trading: Master the Three Phases of AMD
The Three Phases of the AMD Framework
The AMD framework revolves around three key phases: accumulation, manipulation, and distribution. Each phase offers insights into market behavior and helps traders identify actionable opportunities. Let’s break down how each phase impacts market dynamics.
Accumulation Phase: Quiet Buying
During the accumulation phase, institutional investors often build positions without causing a noticeable price surge. They may execute trades in smaller increments or use dark pools. This phase is characterized by specific signals:
- Volume patterns: Increased volume on days when prices rise and decreased volume on down days.
- Price behavior: Consolidation within a narrow range, forming a base.
- Market sentiment: A bearish or neutral outlook that discourages retail participation.
For instance, in November 2020, several executives at Matador Resources purchased shares during a period of market uncertainty. Over the next two years, the stock materially outperformed, illustrating how early accumulation can precede significant trends.
| Volume Signals | Price Patterns | Market Conditions |
|---|---|---|
| Higher volume on up days; lower on down days | Tight range consolidation forming a base | Bearish or neutral sentiment |
| Institutional buying during dips | Repeated support level bounces | Negative or minimal news coverage |
Recognizing accumulation is critical for positioning trades early, as it often precedes significant market shifts.
Manipulation Phase: Emotional Traps
The manipulation phase features price moves that can exploit retail traders’ emotions. Tactics include stop hunts, false breakouts, and practices such as wash trading, front-running, pump-and-dump schemes, and layering/spoofing. A notable example is an executive’s public statement causing a temporary price spike followed by heightened volatility.

To avoid falling victim to manipulation, traders should:
- Verify information through reliable sources.
- Analyze volume and momentum to confirm potential breakouts.
- Wait for multiple indicators—both technical and fundamental—before taking action.
Patience is key. Jumping into trades based on initial price moves can lead to costly mistakes. By identifying manipulation, traders can sidestep false signals and focus on genuine opportunities within the AMD cycle.
Distribution Phase: Quiet Selling
The distribution phase signals the systematic unloading of positions, often marking the end of an uptrend. During this stage, control shifts from buyers to sellers, and prices begin to decline or move sideways. This phase typically shows:
- Higher trading volumes as large positions are reduced.
- Consolidation patterns with occasional volatility.
- Retail traders mistaking short-term bounces for a continued uptrend.
A common tactic during distribution involves trading the range—buying at its lows and selling at its highs—while placing stop-losses beyond the range. However, support and resistance levels that held firm earlier may fail during sharp moves. Look for confirmation via volume spikes or breakouts in the opposite direction before entering trades.
The AMD cycle plays out across various timeframes, from intraday to long-term trends. Recognizing the distribution phase helps traders exit before major reversals and prepare for the next cycle.
Technical Analysis for Identifying AMD Phases
Identifying shifts between accumulation, manipulation, and distribution phases benefits from combining multiple techniques. Using volume analytics, pattern recognition, and market structure can confirm transitions and minimize false signals.
Volume-Price Analysis
Volume analysis helps assess buying and selling pressure behind price moves. Because volume changes can precede price action, it often acts as a leading input for spotting phase transitions.
- Accumulation: Higher volume on up days vs. down days; occasional spikes on dips suggesting accumulation.
- Manipulation: Erratic volume; spikes during false breakouts or reversals; watch for price/volume divergences.
- Distribution: Increased selling pressure; failure to make new highs; higher volume on down days.
In thinly traded markets, relative volume metrics can flag unusual activity. Combining volume signals with patterns gives a clearer read on AMD phase shifts.
Common Chart Patterns
The Wyckoff Method is a classic approach for mapping AMD-like transitions via patterns. For example, a "spring" or "shakeout" tests support before a breakout. Consolidation zones after retracements to new highs can precede springs.
- Manipulation: False breakouts where price briefly breaches key levels before reversing—often trapping late entries.
- Distribution: "Upthrusts/throwovers" temporarily exceed resistance then reverse; lower highs and rising volatility signal a shift.
Volume is critical for confirmation. Genuine breakouts during accumulation should show rising volume, while distribution often shows increased volume on declines. Consider using stop-loss orders placed beyond recent ranges (overview of stop-loss orders). Aligning these patterns with volume can improve accuracy and set the foundation for automation.
Using LuxAlgo on TradingView for AMD Detection
LuxAlgo provides specialized TradingView toolkits that help automate AMD detection. Here’s how key tools contribute:
- PAC Toolkit: Identifies accumulation and distribution zones using pattern recognition and order block analysis; highlights shifts in market structure.
- Signals & Overlays (S&O): Flags probable manipulation and confirms genuine breakouts; visual overlays surface price/volume divergences.
- Oscillator Matrix (OSC): Provides insights into divergences and money flow; offers reversal/trend signals to confirm when manipulation ends.
Screeners complement these toolkits by scanning markets for AMD setups, reducing manual charting. LuxAlgo also offers backtesting utilities to trial ideas before risking capital.
For deeper strategy design, try AI Backtesting—LuxAlgo’s AI agent for creating and testing trading strategies. It can iterate through AMD-style parameter combinations and surface promising configurations.
Applying the AMD Strategy in Live Trading
Putting AMD into practice requires precise timing and disciplined risk management. Success hinges on spotting phases, protecting capital, and adapting to live conditions.
Entry and Exit Point Timing
The key lies in recognizing accumulation and distribution. During accumulation, look for tight consolidation/basing, prices holding above a rising moving average, and building volume. Consider entries after a confirmed breakout with volume. In distribution, look for lower highs/lows and sustained weakness—prices riding below a declining moving average.
For more precision, many traders blend higher-timeframe bias with intraday execution. Use the session’s open as a reference and track range expansions. On 5–15 minute charts, watch for liquidity grabs, market structure breaks, candlestick patterns, moving-average crossovers, or momentum shifts. If you miss an opportunity during manipulation, wait for a market-structure break and pullback during distribution to re-enter.
This disciplined approach naturally ties into effective risk management.
Risk Management Best Practices
Manipulation phases can be volatile. Consider smaller position sizes and wider stops to account for swings. Some brokers offer guaranteed stop-loss orders that close trades at predefined levels during gaps. Diversify across assets and avoid over-leveraging. Stay systematic and avoid impulsive decisions.
Case Study: AMD Strategy in Action
Consider NASDAQ (NQ futures). Start with higher timeframes (4H/D) to set bias—e.g., a bullish bias if the prior close breaks a key resistance. Then plan intraday execution.
- Accumulation: Early session consolidation within a tight range; rising volume on modest up-moves suggests accumulation.
- Manipulation & Entry: A false breakdown may trigger stops. If price reclaims the range on strong volume, that can be an entry with predefined risk.
- Distribution: Later, lower highs and weakening momentum suggest scaling out or exiting longs.
This illustrates how AMD blends multi-timeframe context with precise execution to reduce guesswork.
Backtesting and Improving the AMD Strategy
Backtesting validates AMD rules before deploying live and helps refine them as conditions change.
Why Backtesting Is Important
Testing across bull, bear, and range-bound regimes can confirm entry/exit rules and improve drawdown control.
Leveraging AI Backtesting
LuxAlgo’s AI Backtesting platform evaluates many parameter combinations (e.g., volume thresholds, moving-average lengths, breakout filters) and summarizes promising configurations for AMD-style strategies.
Adjusting the Strategy for Different Markets
Adaptation matters. Forex trades 24/5 with session-based liquidity; crypto is 24/7 and more volatile; stocks can show clearer AMD patterns but are affected by earnings and macro releases. Avoid overfitting—prefer stable changes that generalize across conditions. Track results and prioritize minimizing drawdowns over maximizing raw returns.
Conclusion: Mastering the AMD Trading Strategy
The AMD approach structures how institutional activity can shape price via accumulation, manipulation, and distribution. By recognizing these cycles, you can align with prevailing flows for higher-probability trades.
Each phase can frame quality setups. Combine classical tools—volume analysis, support/resistance, candlesticks—with LuxAlgo’s TradingView toolkits. This streamlines multi-timeframe analysis and bridges analysis to execution.
Timing matters. Entering after manipulation lowers the risk of emotional swings and aims to capture cleaner trends during distribution. Define phase-specific rules to stay focused.
Different markets need tailored tactics. For example:
- Forex: Respect session-driven liquidity changes.
- Crypto: Account for 24/7 trading with wider stops and faster management.
- Equities: Be cautious around earnings and major data releases.
Backtesting these variations helps maintain consistency. Pair AMD principles with disciplined risk management for a systematic, adaptable process.
FAQs
How can traders identify and respond to the accumulation, manipulation, and distribution phases in real-time trading?
To spot and react to the accumulation, manipulation, and distribution phases as they unfold, monitor price action and volume closely.
During accumulation, prices often compress with low volatility while volume gradually rises—repeated tests of support are common.
In manipulation, sharp spikes and false breakouts can occur. These moves are typically short-lived and designed to trigger stops.
Finally, distribution appears as selling increases; trend reversals become more probable. Recognizing these shifts helps fine-tune entries/exits with the broader flow.
How can I avoid falling for market manipulation tactics like stop hunts and false breakouts?
Place stop-loss orders beyond key levels and wait for confirmation (e.g., volume expansion, supportive price action). The Relative Strength Index can help identify overbought/oversold conditions that often precede reversals. Stay aware of news catalysts that can amplify manipulation.
How can I customize LuxAlgo on TradingView for different conditions when using AMD?
You can tailor settings such as mode (long-only/short-only/both), periods, visualization, and multi-timeframe confirmation. Consider combining tools for context and set alerts so you’re informed when custom conditions occur.
References
LuxAlgo Resources
- Breakouts with Tests & Retests
- Market Structure & Volume Distribution
- PAC Toolkit — Introduction
- Oscillator Matrix
- Support & Resistance — Dynamic
- Volumetric Toolkit
- Dynamic Order Blocks
- Market Structures — PAC Docs
- OSC Reversal & Trend Signals
- AI Backtesting — Main Page
- PAC Backtester — Exits
- Liquidity (PAC Docs)
- Market Structure Breakers
- Candlestick Structure
- S&O Alerts
External Resources
- Dark Pools — Investor.gov
- Wash Trading — CFTC
- Front-Running — Investopedia
- Pump-and-Dump — SEC
- Layering/Spoofing — CFTC
- Wyckoff Method — Investopedia
- Stop-Loss Orders — Investopedia
- Guaranteed Stop-Loss — Investopedia
- NASDAQ — Official Site
- Matador Resources — Investor Site
- Relative Strength Index (RSI) — Investopedia


