
Learn to identify and trade the bear flag pattern to capitalize on downtrends safely, with strategies for entry and risk management.
The bear flag pattern is a reliable way to seek short-side opportunities in strong downtrends. LuxAlgo’s free Library and its Exclusive Toolkits help traders confirm the setup and manage risk. Here’s what you need to know:
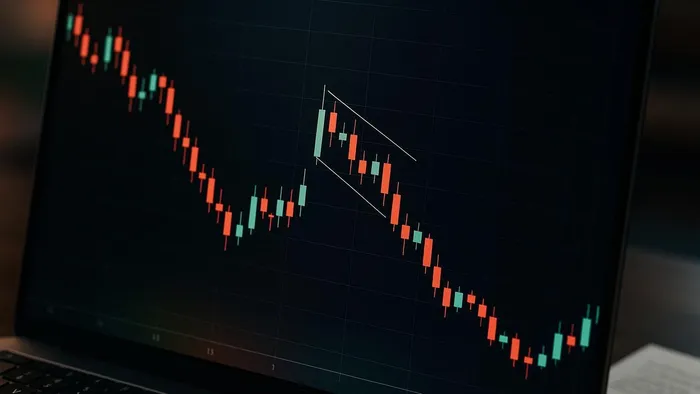
- What is it? A bearish continuation pattern that often precedes further price declines.
- How does it work? It has three phases:
- Flagpole: A sharp price drop with above-average volume.
- Flag: A slight upward consolidation (typically less than 50 percent retracement of the flagpole).
- Breakout: Price falls below the flag’s lower boundary with renewed volume.
- Historical performance: A 60–70 percent continuation rate in pronounced downtrends according to LuxAlgo’s AI Backtesting Assistant.
- Profit potential: Median follow-through of roughly 8 percent once the breakout is confirmed.
Key Tips for Trading Bear Flags
- Watch for high volume on the flagpole and a volume surge at the breakout.
- Place a stop-loss a little above the flag’s upper boundary.
- Aim for a reward-to-risk ratio of at least 2:1.
This pattern can be applied to stocks, forex, and crypto. Use momentum gauges such as RSI plus LuxAlgo’s Volumetric Toolkit or Signals & Overlays Toolkit to confirm validity.
Bear Flag Pattern: How to Identify It and Trade It Like a Pro
Pattern Recognition
The bear flag pattern develops in three clear stages, each offering essential clues for timing entries and exits.
Flagpole Formation
Look for the following:
- A steep decline of 10–20 percent in a short time
- Volume at least 50 percent above recent averages
- Successive lower highs and lower lows confirming momentum
Price Consolidation
The “flag” phase generally lasts three to ten sessions:
| Component | Key Characteristics | Red Flags |
|---|---|---|
| Price Action | Trades within parallel lines | Choppy, erratic movement |
| Slope | Mild upward angle (0–30°) | Steep upward angle (>30°) |
| Retracement | <50 percent of flagpole | >50 percent retracement |
| Volume | Gradually decreases | Unexpected spikes |
Breakout Signals
- A decisive close beneath the lower trend-line
- Volume expansion of roughly 50 percent above average
- A follow-through move that holds below the breakout level
Trading Methods
Entry and Exit Points
Enter on the first close below the flag’s lower boundary with higher volume. Project the length of the flagpole downward to set a logical target.
Stop-Loss Rules
Place the stop 1–2 percent above the flag’s upper boundary. A good example is Tesla (TSLA) in early 2023, where above-flag stops kept risk low.
Risk Management
Risk no more than 1–2 percent of account equity per trade and target at least a 2:1 reward-to-risk profile.
Pattern Confirmation
Volume Patterns
| Phase | Volume Behaviour | Interpretation |
|---|---|---|
| Flagpole | Surge above average | Validates strong selling |
| Flag | Volume fades | Buying pressure subsides |
| Breakout | Renewed surge | Confirms continuation |
Market Trend Check
- Flagpole momentum supported by bearish volume
- Flag angled modestly upward
- Bearish structure remains on higher timeframes
Failed Pattern Signs
- Deep Retracement — more than half the flagpole.
- Volume Conflicts — inconsistent surges during consolidation.
- Bullish Price Action — multiple closes above resistance or bullish reversal structures within the flag.
Technical Analysis Tools
LuxAlgo provides several Exclusive Toolkits that simplify spotting and validating bear flags.
Pattern Scanner
The Pattern Detector auto-identifies bear flags across timeframes.
| Metric | Purpose |
|---|---|
| Flagpole Length | Projects potential target |
| Flag Width | Validates consolidation |
| Flag Slope | Confirms mild retracement |
Indicator Support
The Oscillator Matrix Toolkit and Signals & Overlays Toolkit add confluence:
- MACD crossover confirming bearish momentum
- Bollinger Bands showing volatility squeeze before breakout
- RSI overbought-during-flag readings
Strategy Testing
Use AI Backtesting Assistant docs plus the live AI Backtesting platform to validate bear-flag rules on historical data.
Summary
Pattern Recognition Tips
Strong flagpole drop, consolidation retracing less than 38 percent, and price staying under the 50-period moving average throughout formation are key reliability markers.
| Validation | Positive Sign | Warning |
|---|---|---|
| Trend Strength | Over 60 percent continuation | >50 percent retracement |
| Volume Profile Maps | High volume on flagpole | Choppy volume |
| Price Action | 8 percent median post-breakout move | Break above resistance |
Tool Integration
Combine LuxAlgo’s Price Action Concepts Toolkit with Signals & Overlays for structure and momentum confirmation. Full documentation is available for S&O, Oscillator Matrix, and Price Action Concepts.
Next Steps
- Back-test flag entries with the AI platform, then monitor real-time setups in the Pattern Detector.
- Keep risk small and targets realistic; review LuxAlgo plan options if you need access to Exclusive Toolkits.
- Study the full Toolkit feature list for more automation ideas.
FAQs
How can I use volume analysis to confirm a bear flag pattern in trading?
To identify a bear flag pattern with volume analysis, pay attention to three important volume behaviours:
- High volume during the sharp price drop that forms the flagpole.
- Lower volume as the price consolidates or pulls back upward, creating the flag.
- A spike in volume when the price breaks below the flag's lower boundary, signalling the continuation of the downtrend.
These volume trends are essential for confirming the pattern's strength and can boost your confidence in recognising and acting on this bearish setup.
What are some common mistakes traders make when identifying a bear flag pattern?
Traders often slip up when trying to spot a bear flag pattern, and these missteps can lead to poor choices in bearish markets. One frequent error is mistaking a short-term consolidation for a bear flag when it doesn’t meet the key criteria, like a distinct downward trend leading into the pattern or a clearly defined flagpole.
Another common issue is overlooking volume analysis. A genuine bear flag typically features a strong sell-off (the flagpole) accompanied by high volume, followed by a period of consolidation (the flag) with noticeably lighter volume. Skipping this step can lead to falling for false signals.
Lastly, jumping into trades too early is a mistake many traders make. Entering before the price breaks below the flag’s lower boundary can be risky. Waiting for a confirmed breakout is critical to ensure the pattern signals a bearish continuation before committing.
How can the bear flag pattern be used in markets like forex and crypto?
The bear flag pattern is a handy chart formation that traders can use across different markets, such as forex and crypto. It helps spot moments when a bearish trend is likely to continue after a short pause, offering opportunities to take advantage of a downtrend.
This pattern works well for both short-term and long-term strategies, making it a go-to for day traders and swing traders. By identifying the bear flag’s characteristic shape and backing it up with other analysis tools, traders can improve their timing for entries and better manage risks, even in unpredictable market conditions.
References
- LuxAlgo – Home
- Volumetric Toolkit
- Reversal Candlestick Structure
- Volume Profile Maps
- Signals & Overlays Toolkit
- Oscillator Matrix Toolkit
- Price Action Concepts Toolkit
- Pattern Detector
- AI Backtesting Platform
- AI Backtesting Assistant Documentation
- Signals & Overlays Documentation
- Oscillator Matrix Documentation
- Price Action Concepts Documentation
- LuxAlgo Pricing
- LuxAlgo Toolkits Overview
- Relative Strength Index
- Tesla, Inc.
- MACD
- Bollinger Bands
- Bear Flag Pattern Video


