Understand how big body candlesticks reveal market sentiment and enhance your trading strategies with effective analysis and verification techniques.
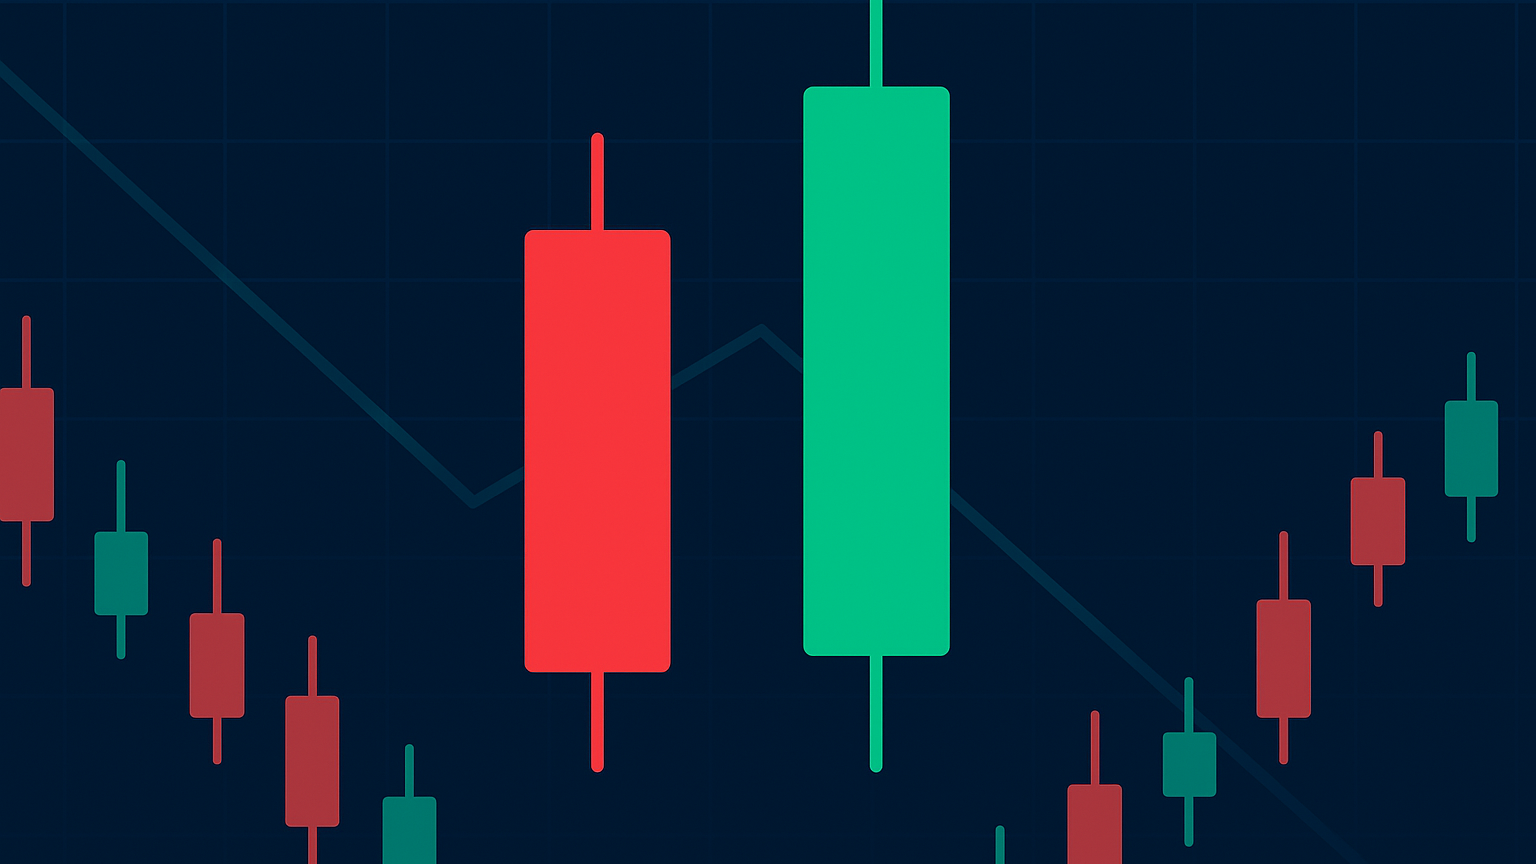
Big body candlesticks are powerful components of technical analysis, helping traders identify market sentiment and predict price movements. These candlesticks have a large real body, short wicks, and stand out compared to nearby candles. Here's what you need to know:
- Bullish Candlesticks: Green/white with a close far above the open, signaling strong buying pressure.
- Bearish Candlesticks: Red/black with a close far below the open, indicating intense selling pressure.
- Key Patterns: Examples include Bullish Engulfing (65% success rate), Morning Star (65%), and Evening Star (69% for bearish reversals).
- Volume Matters: High trading volume strengthens the reliability of these patterns.
- Best Use Cases: Effective in trending markets (~70% accuracy) but less reliable in range-bound markets (~40%).
Quick Tip: Combine candlestick signals with technical tools like RSI, MACD, and Bollinger Bands for better confirmation. Always validate patterns with volume and market context before acting.
Read on to learn how to use these candlesticks for trade entries, exits, and risk management.
Big Body Candlestick Types and Signals
Upward Market Signals
Bullish big body candlesticks occur when the closing price is significantly higher than the opening price, resulting in a noticeable green (or white) body. One classic example is the Bullish Marubozu, which forms when buyers dominate the entire trading session, leaving little to no wicks.
Here’s a breakdown of some common bullish candlestick patterns and their historical performance :
| Pattern Type | Success Rate | Key Characteristics | Trading Significance |
|---|---|---|---|
| Bullish Engulfing | 65% | Large green body covering prior red candle | Indicates a strong reversal |
| Morning Star | 65% | Three-candle pattern ending with a big green candle | Signals a bottom reversal |
| Bullish Harami | 54% | Large green body following a downtrend | Suggests a potential trend change |
Downward Market Signals
Bearish candlestick patterns reflect the opposite sentiment. These form when sellers are in control, leading to a large red (or black) body where the closing price is much lower than the opening price. A notable example is the Bearish Marubozu, which shows consistent selling pressure throughout the session.
The Evening Star pattern, with a 69% success rate for signaling bearish reversals, is particularly important when it appears near market peaks. Its reliability increases if accompanied by higher trading volume, reinforcing the bearish outlook. Both bullish and bearish signals can be further refined by analyzing the candlestick’s color and position.
Color and Position Analysis
The position of a candlestick in relation to support or resistance levels adds weight to its signal. For instance:
- A large bullish candlestick forming at a support level often indicates strong buying momentum.
- Conversely, a bearish candlestick near resistance suggests intensified selling pressure.
"Each candlestick is a simple, yet powerful tool to understand what's happening in the market." – Steve Nison
To improve accuracy, consider these factors:
- Volume Confirmation: High trading volume during the formation of a big body candlestick adds credibility to the signal.
- Market Context: Assess the pattern within the broader trend and current market conditions.
- Technical Validation: Use indicators like RSI or MACD to confirm the signal.
The Tweezer Bottom pattern, with a 61% success rate for predicting bullish reversals, highlights the importance of position. When this pattern forms near established support levels, its reliability grows, offering traders a stronger basis for decision-making. Combining positional analysis with other tools helps refine strategies and improve outcomes.
Signal Analysis and Verification
Market Trends and Pattern Groups
Big body candlesticks can be more reliable when analyzed within their market context. Research from the Technical Analysis Society of America shows that combining candlestick patterns with tools like moving averages and momentum indicators can improve trade accuracy by 20–25% across different markets and timeframes. In strongly trending markets, these patterns have around 70% accuracy for identifying continuation or reversal signals, compared to about 40% in range-bound or flat markets.
Here’s a quick breakdown for evaluating market conditions:
| Market Condition | Expected Accuracy | Best Use Case |
|---|---|---|
| Strong Trend | ~70% | Trend-following strategies |
| Range-bound | ~40% | Generally avoid trading |
To validate signals, use technical indicators such as RSI, MACD, or Bollinger Bands. Pair these with an analysis of volume patterns for stronger confirmation.
Volume Analysis
Volume plays a crucial role in confirming big body candlestick signals. As the second most important chart element after price, it provides insight into the strength and conviction behind price movements.
A big body candlestick gains importance when accompanied by above-average volume, signaling strong market commitment. Use the following volume guidelines:
| Volume Level | Signal Strength | Trading Implication |
|---|---|---|
| Above Average | Strong | High-probability setup |
| Average | Moderate | Wait for further confirmation |
| Below Average | Weak | Possible false signal |
Be cautious of volume spikes in low-liquidity environments, as they may not reflect genuine market interest.
Trading Methods with Big Body Candlesticks
Technical Tools for Candlestick Trading
LuxAlgo’s Exclusive Tools
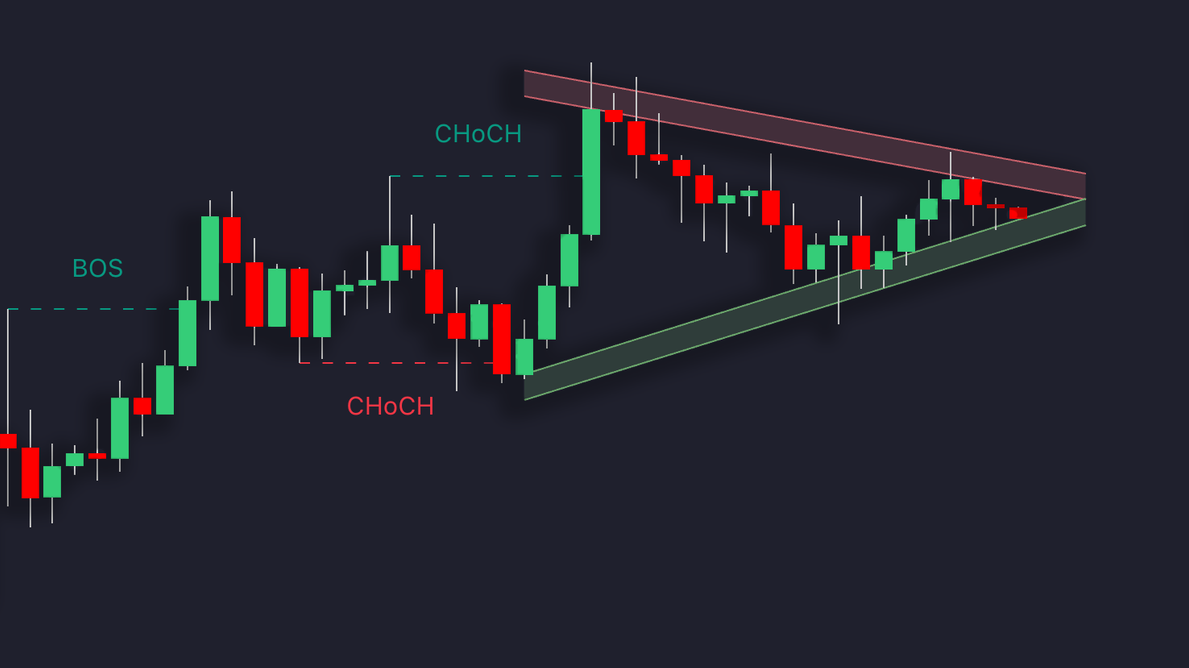
LuxAlgo provides exclusive capabilities on TradingView to analyze candlestick patterns and test trading strategies. Here’s a breakdown:
| Toolkit/Service | Primary Function | Key Features |
|---|---|---|
| PAC Backtester | Backtests price action strategies | Custom entry/exit conditions using market structure, order blocks, and imbalances |
| S&O Screener | Scans multiple timeframes | Real-time detection of Signals & Overlays™ features |
| AI Backtesting Assistant | Generates and refines strategies | Automates strategy creation using AI on LuxAlgo.com/backtesting |


