Triangles in Charts: Sym & Asym Patterns
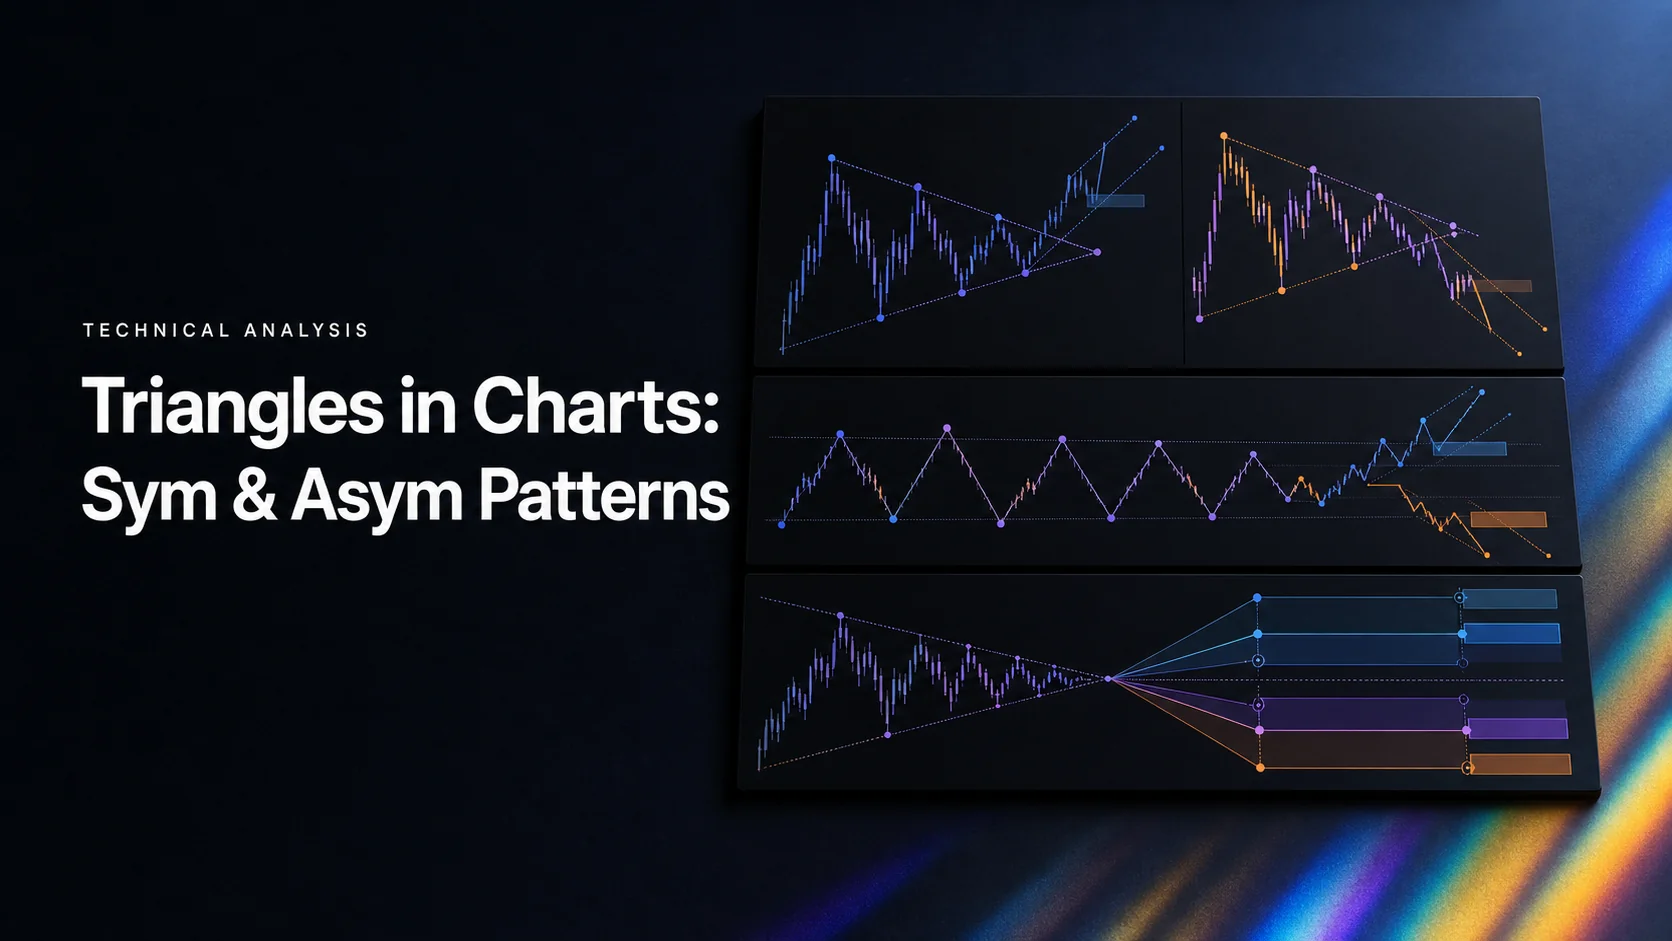
Triangle patterns describe a price range that narrows between converging boundaries. A symmetrical triangle combines lower highs with higher lows; ascending and descending triangles pair a sloping boundary with a roughly horizontal one. These shapes help organize consolidation and breakout scenarios, but they do not predict a guaranteed direction or return.
LuxAlgo’s charting and AI platform provides a practical way to examine those scenarios. Mark the boundaries on Quant Charts, compare the pattern with its Library reference, and use Quant, our coding agent, to develop explicit rules that you inspect and run manually.
Key Trading Tips
- Draw boundaries from identifiable swing points and record when each point became confirmed.
- Define the breakout using a close, a price buffer or another repeatable condition.
- Compare volume and momentum with a consistent baseline instead of treating them as proof.
- Choose invalidation, position size and costs before evaluating a measured target.
| Pattern type | Boundary geometry | Breakout interpretation |
|---|---|---|
| Symmetrical | Lower highs and higher lows. | Either direction; a prior trend is context, not certainty. |
| Ascending | Approximately horizontal highs and rising lows. | Conventionally bullish, but a downside failure is possible. |
| Descending | Approximately horizontal lows and falling highs. | Conventionally bearish, but an upside failure is possible. |
Breakout direction is not a success rate. A study reporting the proportion of upward breaks is different from one reporting target attainment or profitable trades. Figures such as 54%, 72.77%, 72.93% or 77% should not be applied universally without a traceable sample, pattern definition, period and outcome measure.
Triangle Price Pattern Trading Strategy Guide
3 Main Triangle Pattern Types
Symmetrical Triangles
A symmetrical triangle needs declining swing highs and rising swing lows that produce converging boundaries. “Symmetrical” does not require identical angles or equal line lengths; the chart’s vertical scale can change how steep a boundary looks. The StockCharts symmetrical-triangle guide describes at least two points on each side, with additional touches helping establish the structure.
The pattern can precede continuation or reversal. Do not assume an upward move because an earlier advance preceded the consolidation. Traditional daily-chart discussions often describe formations lasting weeks or months; that convention does not mean every triangle must last one to three months on every timeframe.
For a hypothetical projection, take a widest vertical height of $2.20 and an upward breakout reference of $17.20. The measured target is $19.40. Those inputs illustrate the calculation; they do not establish the original article’s claimed 2021 Northwest Bancshares trade as a verified historical event. A downward break from the same reference would instead project $15.00.
Ascending Triangles
An ascending triangle joins roughly equal highs with successively higher lows. The flat upper boundary represents repeated resistance tests, while rising lows describe a contracting range underneath it. This gives the conventional bullish interpretation, but the actual resolution may be downward.
| Component | Observation | Limit |
|---|---|---|
| Upper boundary | Repeated highs near the same resistance area. | Choose a tolerance; exact price equality is not always required. |
| Lower boundary | Successively higher swing lows. | Only use pivots after the required confirmation bars exist. |
| Frequency | Count qualified setups in the selected sample. | There is no universal seven-to-ten-per-year rate across symbols and settings. |
Use the ascending-triangle reference for the conventional shape and target method. A lower-boundary break invalidates a bullish interpretation under many strategies; do not redraw the pattern indefinitely to preserve the original view.
Descending Triangles
A descending triangle combines roughly equal lows with declining highs. The conventional bearish setup waits for support to break, but the pattern can also resolve upward. The descending-triangle guide explains this geometry and the projection below support.
For a short setup, a stop above the declining boundary or a recent swing high is one possible rule. State which reference applies and whether it moves as time passes. A broader structural stop changes the position size and reward-to-risk calculation.
How to Verify Triangle Patterns
Volume Analysis
Contraction in volume during the range and expansion at a breakout are conventional observations to examine. Compare activity with the same instrument, feed and session. A volume spike does not prove that a breakout will persist, and low volume does not mechanically invalidate every setup.
| Check | Rule to define | Trade-off |
|---|---|---|
| Price confirmation | One close, two consecutive closes, or a specified price buffer beyond the boundary. | More confirmation delays entry and can increase the distance to invalidation. |
| Volume | A chosen comparison with a recent or session-adjusted baseline. | Different feeds capture different activity; unavailable volume is not zero. |
| Follow-through | What qualifies as a return inside the triangle or failure to progress. | The rule must be observable at the time, not chosen after seeing the outcome. |
Best Timeframes to Use
Daily charts can show the broader consolidation; four-hour charts can offer a more detailed view of its development. Intraday patterns cover different market conditions and execution costs. Treat timeframe as a research choice rather than assigning “high reliability” to daily charts and “moderate reliability” to four-hour charts without evidence.
When using a higher-timeframe filter, only use its completed candle after that close becomes available. Keep session boundaries, timezone and price adjustments consistent. Check Quant Charts data coverage before treating exchange-specific volume as consolidated market volume.
Technical Indicator Support
RSI and MACD can make momentum conditions explicit. An RSI above 70 may accompany strong upward momentum but does not guarantee continuation; a reading below 30 does not prove a successful downside break. Divergence is a warning to assess, not a timed reversal instruction.
A MACD crossover and its position relative to zero are separate conditions. Test whether either improves the same breakout strategy after costs. Several indicators calculated from the same price series are not automatically independent confirmation.
Triangle Pattern Trading Methods
Entry and Exit Rules
Specify whether entry occurs on a stop trigger, a confirmed close followed by the next available fill, or a retest. Waiting for two closes is one possible filter, not a universal definition. A close-based signal cannot assume an earlier fill at the boundary within that same candle.
| Scenario | Trigger example | Measured target |
|---|---|---|
| Ascending triangle, upward break | Completed close above the horizontal upper boundary. | Add the chosen base height to the breakout reference. |
| Descending triangle, downward break | Completed close below horizontal support. | Subtract the chosen base height from the breakout reference. |
| Symmetrical triangle, either direction | Confirmed break beyond the appropriate sloping boundary. | Add height for an upward break; subtract it for a downward break. |
Measure height vertically in price units and record the endpoints used. A projected target is a planning reference, not an obligation for price. Nearby support or resistance may provide a competing exit level before the full projection.
Risk Control Steps
For a hypothetical long entry at $17.20 with invalidation at $16.65, planned risk is $0.55 per share. A $110 risk budget permits 200 shares before costs. The $19.40 target offers $2.20 per share, or 4R. A worse fill, fees or slippage lowers that ratio; a gap through the stop can increase the loss.
A stop beneath a recent swing low, beneath the broken boundary, or beyond the opposite side of the triangle expresses a different invalidation rule. Choose it before sizing the position. Do not widen the stop later merely to avoid realizing a loss.
LuxAlgo Tools Integration
The Library’s pattern and trendline tools frame converging boundaries on a Quant Chart, and its momentum tools add a second reading. Qualifying trendlines are often drawn once a pivot is confirmed, so a historical label does not establish that the same information was available at the earlier plotted point. Neither a pattern label nor an oscillator confirms a trade; configure alerts for supported conditions and verify their timing rather than assuming every manually drawn triangle is monitored.
A Native Quant Charts Research Workflow
Use Quant Charts to prepare the chart and record the triangle’s anchor points. Add relevant Library indicators to inspect context, and keep those settings fixed while comparing examples. The platform demonstration below shows adding indicators; use only the tools required by the question being studied.
Ask Quant, our coding agent, to implement an explicit study:
Accept four manually selected, already confirmed anchor points: two descending highs and two rising lows, with their bar times and confirmation times. Start evaluating only after all four are known. Extend the two fixed straight boundaries, identify the first completed close outside them before their intersection, and record direction. Do not move anchors afterward or assume trade fills.
That specification studies a manually defined triangle, not a general automatic detector or complete strategy. Add entry timing, stops, targets, sizing, overlap rules and costs before evaluating returns. Follow Making Strategies with Quant: inspect the generated code and run it manually, then compare individual events with the chart.
Reserve unseen history and check nearby parameter choices.
Advanced Triangle Trading
Non-Standard Triangle Types
Uneven slopes do not necessarily invalidate a symmetrical triangle. What matters is the sequence of highs and lows and convergence over time. If both boundaries slope upward or downward, consider whether the shape is a wedge; if they diverge, it is a broadening formation rather than a contracting triangle.
Do not infer buying or selling strength merely from how steep a boundary appears on the screen. Linear versus logarithmic scaling and zoom affect visual angles. A break near the intersection can also occur simply because very little space remains; define how late a breakout may occur in your method.
False Breakout Prevention
False breakouts cannot be eliminated. A close filter, a retest entry, a volume condition or a higher-timeframe filter changes the trades taken and their execution price. Compare those variants rather than assuming more filters must improve results.
Record a failed break consistently, for example a completed close back inside the original boundaries within a specified number of bars. A failure can be studied as a separate setup, but reversing the position requires its own entry, stop and sizing rules.
Market Context Impact
Economic releases, central-bank decisions, earnings and changes in liquidity can produce gaps or rapid movement through a boundary. Review the event calendar and broader trend before deciding whether the strategy permits a trade. Support and resistance outside the triangle also matter when assessing room to a target.
Claims that daily or four-hour triangles are inherently more reliable should be treated as method preferences until supported by an appropriate comparison. Include failed patterns and different market regimes in the sample, not only clean textbook examples.
Conclusion
Triangles organize a narrowing range into observable boundaries, potential triggers and invalidation levels. Distinguish shape from outcome, upward-break frequency from win rate, and historical labels from information available at the time.
Use Quant Charts to document the pattern, relevant LuxAlgo tools to inspect context, and Quant to develop repeatable research rules. The useful result is a method with clear assumptions, checked timing and realistic risk—not a promise that every triangle will reach its target.
Frequently Asked Questions
What makes a triangle symmetrical?
Its upper boundary slopes down through lower highs while its lower boundary slopes up through higher lows. The visual angles do not need to be identical.
Can an ascending triangle break downward?
Yes. Its conventional bullish interpretation does not prevent a downside break. Define how that outcome invalidates or changes the setup.
Is breakout direction the same as trading success?
No. Direction frequency, target attainment and profitable-trade rate measure different outcomes and require explicit definitions.
How is a symmetrical triangle target calculated?
One common method applies the widest vertical height to the breakout reference: add it for an upward break and subtract it for a downward break.
Do two closes or a volume spike guarantee a valid breakout?
No. They are possible filters that affect timing and trade selection; a breakout can still fail.
How can Quant help with triangle research?
Specify anchor selection, confirmation times, boundaries and event rules. Inspect the generated code and run it manually, then add execution and risk rules before evaluating a strategy.
References
LuxAlgo Resources
External Resources
Read next