Long Shadow Candlesticks: Signal Guide
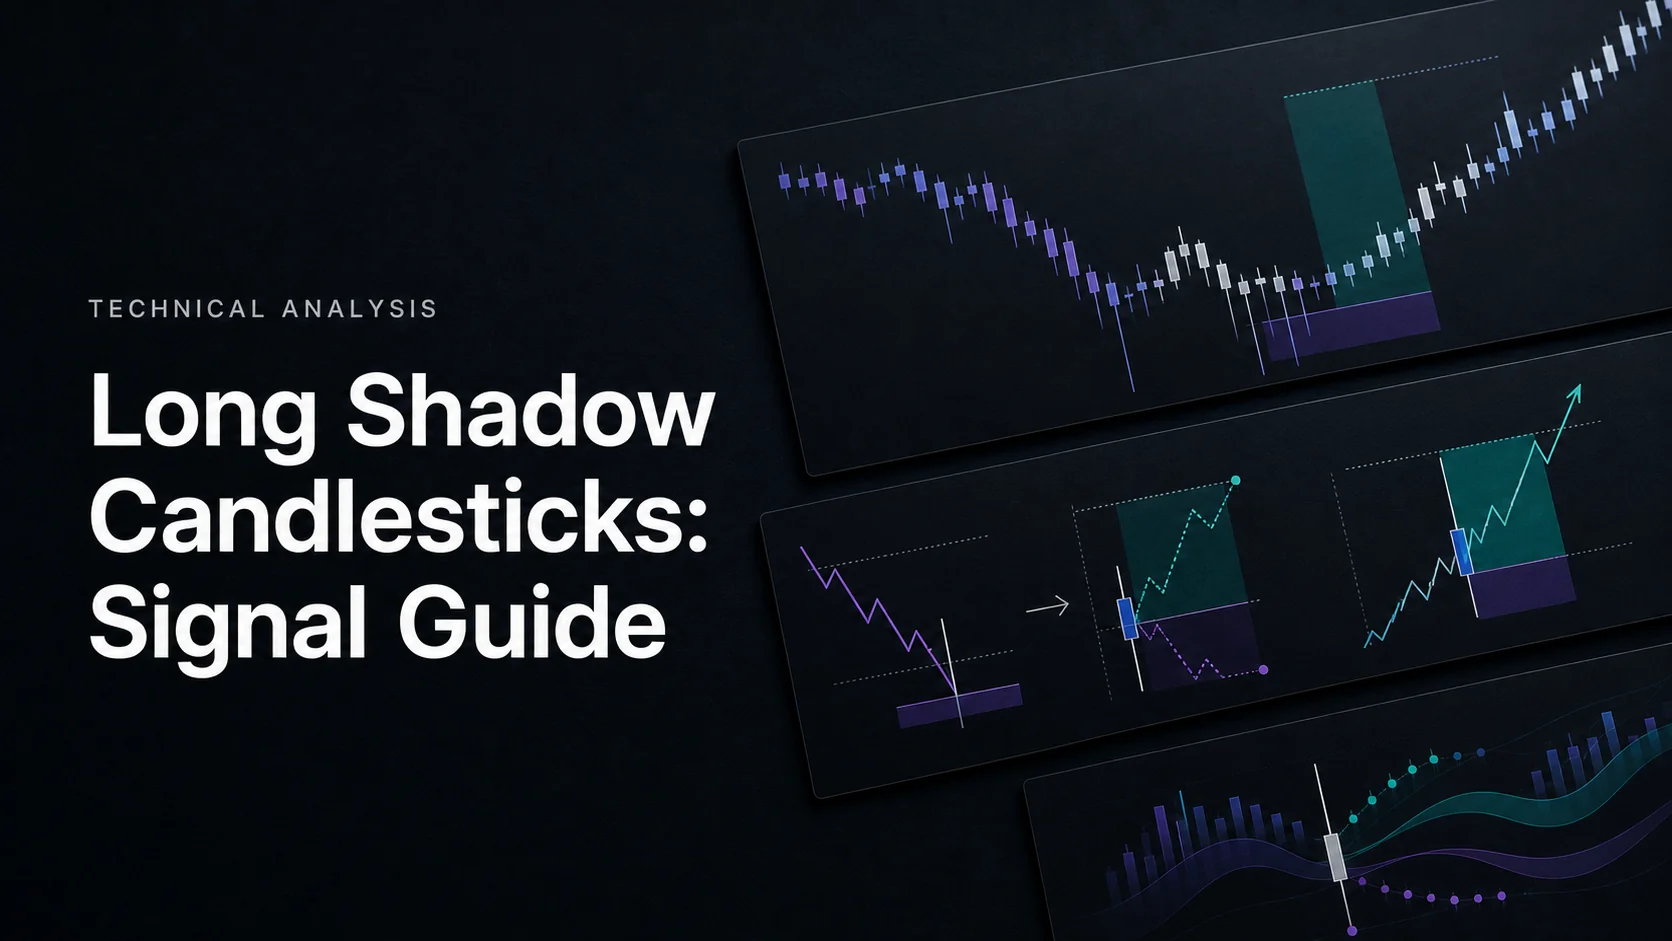
Long shadow candlesticks show that price extended well beyond the candle’s open and close. A long lower wick records a low below the body; a long upper wick records a high above it. Traders study these shapes as possible rejection or reversal signals, but the same geometry can have different implications depending on the preceding trend and subsequent price action.
Use LuxAlgo’s charting and AI platform to examine the candle, record the surrounding levels, and test a precise definition. Quant Charts provides the workspace, while Quant, our coding agent, can help turn a wick measurement into a study or strategy that you inspect and run manually. Candlestick formations are chart observations, not individual products or guaranteed trade signals.
Key Takeaways
- Measure upper and lower shadows separately from the real body.
- A 2:1 wick-to-body ratio is a common convention for certain patterns, not a universal reversal threshold.
- Context distinguishes a hammer from a hanging man, and a shooting star from an inverted hammer.
- Volume and a later confirming candle can define additional conditions; neither guarantees the outcome.
- An indicator’s pattern-filter percentage is not a trading win rate.
Finding Long Shadow Patterns
Parts of a Long Shadow
For a conventional OHLC candle, let O, H, L and C denote open, high, low and close. The StockCharts candlestick introduction explains how the real body and shadows relate to those four values. Calculate distances in price units rather than measuring screen pixels.
| Component | Calculation | Interpretation |
|---|---|---|
| Real body | abs(C − O) | Distance between open and close. |
| Upper shadow | H − max(O, C) | Distance from the top of the body to the high. |
| Lower shadow | min(O, C) − L | Distance from the low to the bottom of the body. |
| Full range | H − L | Total high-low movement; useful when the body is nearly zero. |
A long-shadow reversal convention often asks for one wick at least twice the body, with a short or absent opposite wick. A candle with long wicks on both sides needs a different interpretation: it records movement beyond both ends of the body and may resemble a spinning top or long-legged doji.
How to Spot Them on Charts
A 10-pip body and a 25-pip shadow give a 2.5:1 ratio. That satisfies a 2:1 screen, but it does not establish where the candle occurred or what followed. Compare its range with recent candles and check whether the wick reached a previously identified support or resistance area.
For a hypothetical stock candle with O = $100, H = $102, L = $94 and C = $101, the body is $1, the upper wick $1, and the lower wick $6. The lower-shadow ratio is 6:1 and the full range is $8. Those measurements describe the shape; classifying it as a reversal setup also requires context and an explicit rule for the opposite wick.
Do not divide by a zero-sized body. For doji-like candles, define a small-body tolerance using tick size or a fraction of the full range, and evaluate the wick relative to the range. A candle with H = L has no range and should not qualify merely because the wick calculation breaks.
Key Pattern Types
| Pattern | Typical geometry | Context to check |
|---|---|---|
| Hammer | Small body near the top, long lower shadow. | After a decline; a candidate bullish reversal requiring further evidence. |
| Hanging man | Similar shape to a hammer. | After an advance; the lower wick does not automatically make it bullish. |
| Shooting star | Small body near the bottom, long upper shadow. | After an advance; bearish reversal interpretation depends on follow-through. |
| Inverted hammer | Similar shape to a shooting star. | After a decline; a possible bullish setup despite the upper wick. |
| Dragonfly doji | Open and close near the high, long lower shadow. | Near-zero body; direction depends on prior trend, location and confirmation. |
These names describe conventional patterns, not identical definitions across every indicator. Some shooting-star definitions include a gap or star position; a simple wick-ratio screen is broader. State what your method actually tests.
Reading Long Shadow Signals
Up vs Down Signals
A long upper shadow means the final body sits below the period’s high. A long lower shadow means it sits above the low. Traders often call this rejection, but the candle does not identify the participants responsible or prove that a lasting change in control occurred.
OHLC data also does not reveal the sequence of every movement between the open and close. Two different intrabar paths can produce the same candle. If the strategy depends on whether the high or low was reached first, use suitable lower-timeframe evidence rather than assuming the favorable sequence.
Market Trend Impact
Identify the preceding trend before assigning a reversal label. A lower wick after a decline near support poses a different question from the same candle after a long advance. Use a consistent trend definition, such as a moving-average relationship or a sequence of confirmed swings, and record levels before the signal appears.
Long wicks can also arise during news releases, thin trading or rapid volatility changes. Check the feed, session and surrounding candles. A visually striking wick in an illiquid period is not automatically a meaningful rejection of a major level.
Signal Verification
Define confirmation concretely: for example, a later completed close above the signal candle’s high for a bullish setup, or below its low for a bearish setup. Specify how many bars the setup remains valid. Waiting changes the entry price and stop distance, and a confirmed setup can still lose.
Compare volume with an appropriate baseline on the same feed. Higher volume establishes increased activity, not a guaranteed reversal. Check Quant Charts data coverage before treating exchange-specific volume as consolidated market activity; unavailable volume is not zero.
What the LuxAlgo Dashboard Measures
Reversal Candlestick Structure by LuxAlgo is a TradingView indicator that combines 16 candlestick formations with a stochastic-based reversal filter. Trend Length, Threshold and Warmup Length adjust that filter. It can help organize pattern review, but its definition may differ from a simple 2:1 wick rule.
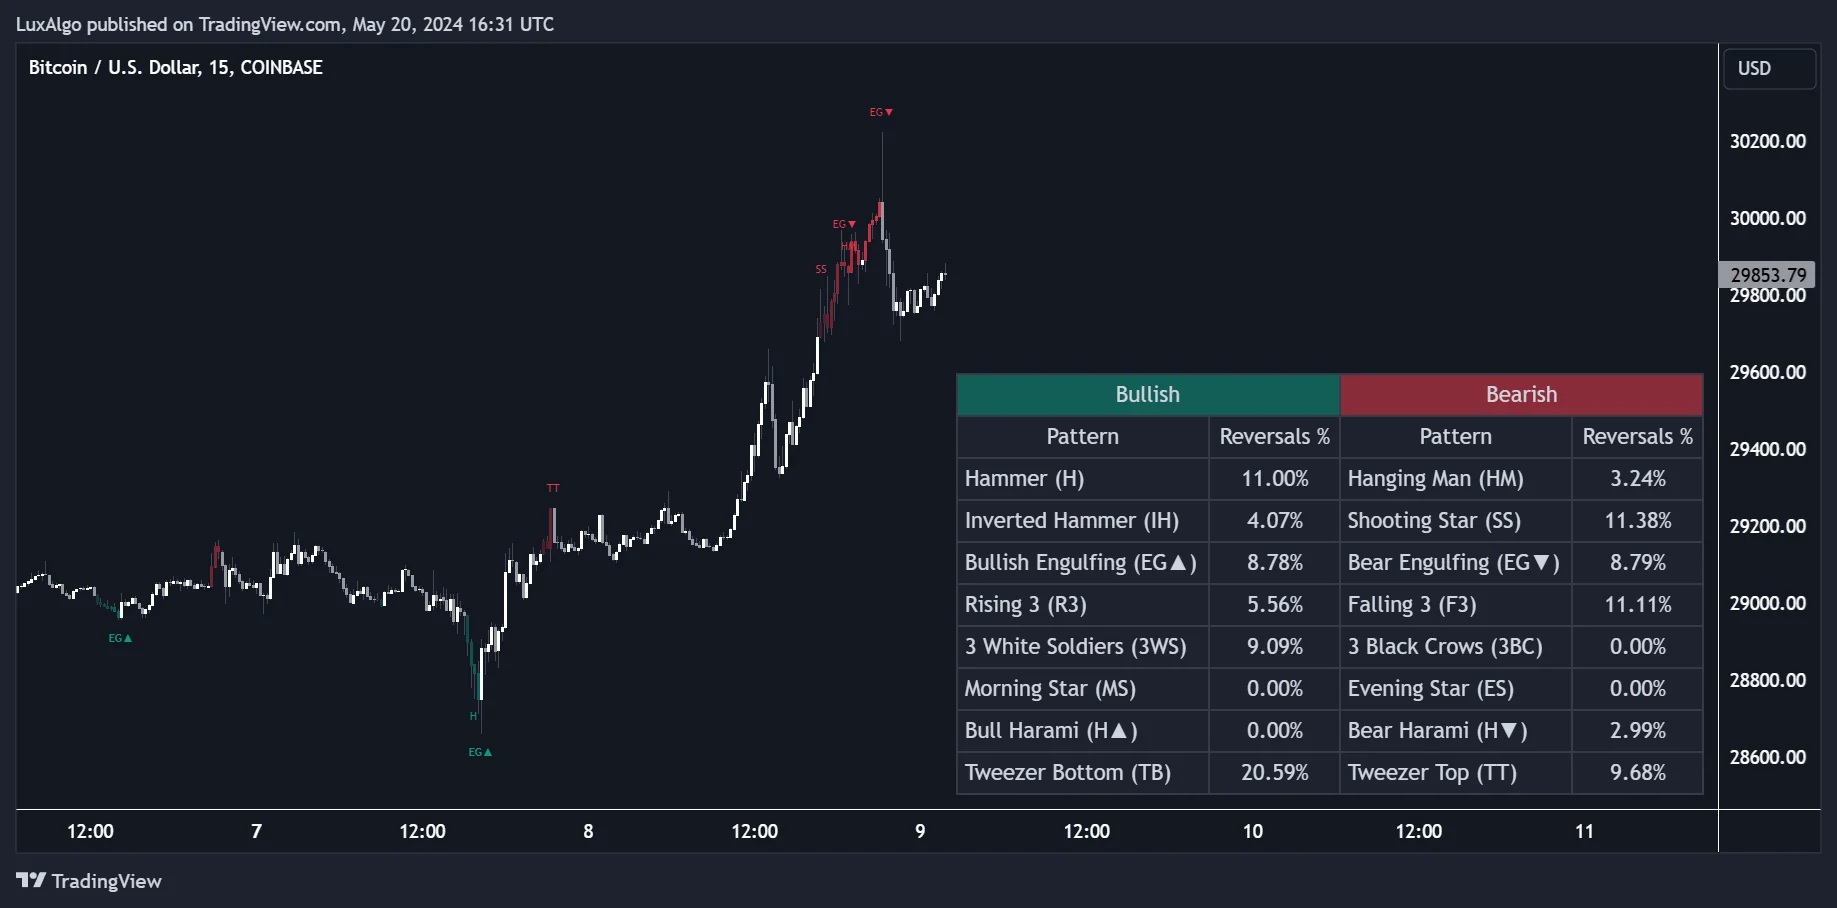
The dashboard divides patterns displayed under the reversal condition by the total detected patterns. Hovering over its cells reveals occurrence counts. Calling those percentages “reliability” or win-rate statistics would overstate what the tool measures.
The separate Candlestick Structure Library indicator uses trend-based pattern filtering. Keep its purpose and settings distinct from Reversal Candlestick Structure. Neither should be presented as a product called “Long Shadow Candlesticks.”
Trading with Long Shadows
Entry and Exit Rules
For a bullish study, look for a qualifying lower wick after a decline near a level defined in advance. For a bearish study, test an upper wick after an advance near resistance. A wick through resistance followed by a close back below it is different from a close that remains above the level; specify which behavior the setup requires.
Choose whether the order follows a completed signal candle, a subsequent confirmation, or a retest. A close-confirmed strategy cannot assume a fill earlier inside that same candle. Define a profit target or exit condition as carefully as the entry.
Stop Loss Guidelines
| Setup | Possible invalidation | Sizing implication |
|---|---|---|
| Bullish lower-wick setup | Below the signal candle’s low, with a defined buffer if used. | A longer wick may require a smaller position. |
| Bearish upper-wick setup | Above the signal candle’s high, with a defined buffer if used. | Calculate risk from the actual planned entry to the stop. |
| Alternative structural stop | A separately identified level or volatility-based distance. | Test as a different rule; do not move the stop after entry to avoid a loss. |
Risk Control Methods
Select a risk budget appropriate to the account and instrument. A percentage such as 1% or 2% is an illustrative choice, not a universally suitable limit. For shares, divide dollar risk by entry-to-stop distance; futures and forex also require the contract’s point or pip value and currency conversion where relevant.
Include spread, commission and slippage. Stops can fill beyond their trigger during a gap or fast market. Volume filters and confirmation candles change which trades occur, but they do not replace position sizing or guarantee that the initial budget will contain the realized loss.
Trading Examples
Chart Examples
Return to the hypothetical $100 open, $102 high, $94 low and $101 close. Suppose this candle forms after a decline near a support zone identified earlier. The long lower wick creates a candidate setup; a volume increase is additional context rather than proof of buying by a particular group.
If the plan enters at $102.50 after confirmation and uses a $93.50 stop, planned risk is $9 per share. A $180 budget allows 20 shares before costs. A $120.50 target offers $18 per share, or 2R. This deliberately wide stop demonstrates why a dramatic wick can result in a small position.
Trade Setup Guide
- Measure body, both shadows and full range on the completed candle.
- Apply the chosen trend, level and volume conditions using only information available then.
- Wait for the defined trigger within the permitted number of bars.
- Calculate quantity from the actual entry and invalidation, including instrument value and costs.
- Record the outcome and the reason for any deviation from the plan.
Common Mistakes
- Treating every lower wick as bullish and every upper wick as bearish, regardless of trend.
- Using an undefined wick/body ratio on a doji or ignoring tiny-range candles.
- Assuming that a volume spike or indicator percentage proves a profitable reversal.
- Identifying support after seeing the bounce, or using an unconfirmed higher-timeframe candle.
- Ignoring how a long wick changes stop distance, quantity and execution risk.
Researching the Pattern with Quant
On Quant Charts, keep the symbol, venue and session consistent while comparing timeframes. A single long wick on one interval can contain several smaller candles on another. The platform’s custom-timeframe demonstration below illustrates why the analysis interval belongs in the research record.
Ask Quant, our coding agent, to build a transparent study before adding trade simulation:
On completed candles with a positive range and body of at least one minimum tick, flag lower shadows at least twice the body, upper shadows no greater than the body, and closes in the upper quarter of the range. Report occurrence counts and next-three-bar returns. Exclude zero-body candles from this version and report their count separately. Do not assume order fills.
The upper-quarter condition is a research choice, not a universal hammer definition. Add a preceding-trend filter if testing reversal behavior, and specify the signal’s confirmation time. Follow Making Strategies with Quant: inspect the generated code and run it manually, then check individual candles against the calculations.
A trading strategy needs entry timing, stop, target, sizing, overlap handling and costs beyond that study. Evaluate unseen history and neighboring settings, and record all variations tried. Keep native Quant research distinct from legacy TradingView toolkit backtesters.
Summary
Main Points Review
Long shadows describe the relationship between a candle’s extremes and its body. Their meaning depends on trend, location, confirmation and the exact definition used. A striking wick, a volume increase or a dashboard percentage cannot guarantee a reversal.
Getting Started
Practice measuring historical candles, including failed setups and doji edge cases. Use Quant Charts to preserve the context and Quant to develop repeatable rules. Demo practice can help test execution without risking trading capital, but simulated results still depend on realistic assumptions.
Frequently Asked Questions
How do I calculate upper and lower shadows?
Upper shadow equals high minus the greater of open and close. Lower shadow equals the lesser of open and close minus low.
Does a long lower shadow always mean a bullish reversal?
No. Its interpretation depends on the preceding trend and follow-through. Similar geometry can describe a hammer after a decline or a hanging man after an advance.
Is a two-to-one wick-to-body ratio mandatory?
It is a common convention for some patterns, not a universal rule for every long shadow. State the threshold and opposite-wick condition used.
How should doji candles be handled?
Avoid dividing by a zero or nearly zero body. Define a small-body tolerance using tick size or range and evaluate that group separately.
Does the Reversal Candlestick Structure percentage show win rate?
No. It measures the share of detected patterns that meet the indicator’s reversal filter, not the share of profitable trades.
Can Quant test a long-shadow rule?
Yes. Specify the measurements, confirmation timing and context. Inspect the generated code and run it manually, then add execution, risk and cost assumptions for a strategy.
References
LuxAlgo Resources
- LuxAlgo Quant
- Making Strategies with Quant
- Quant Charts Data and Market Coverage
- Reversal Candlestick Structure by LuxAlgo
- Candlestick Structure
External Resources
Read next