
Learn how to identify and trade bullish pennant patterns for effective upward trend continuation in various markets.
The bullish pennant flag is a chart pattern that signals the continuation of an upward trend. It is a favorite among traders for its clear entry points, risk-management options, and potential for profit. Here is what you need to know:
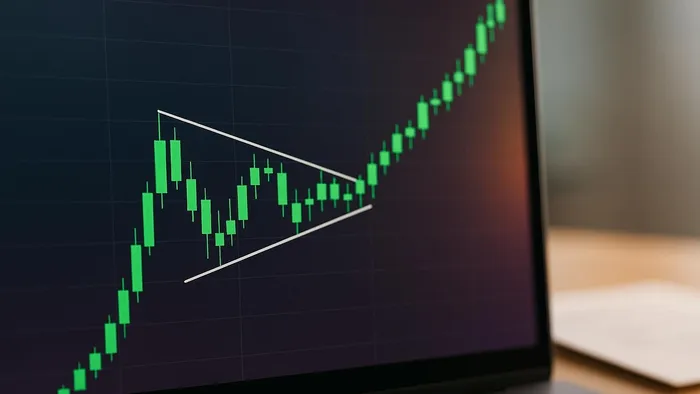
- What It Is: A pattern formed by a sharp price rise (flagpole), followed by a consolidation phase (pennant), and a breakout to the upside.
- Why It Matters: Helps traders spot opportunities during uptrends in stocks, forex, crypto, and more.
- How to Use It:
- Look for a strong initial rally (flagpole).
- Identify a symmetrical triangle during consolidation (pennant).
- Confirm a breakout with increased volume.
- Key Benefits:
- Clear entry signals when price breaks above the pennant.
- Defined stop-loss levels below the pennant.
- Profit targets based on the flagpole’s height.
Bull Pennant Pattern: How to Identify it and Trade it Like a ...
Pattern Structure
The bullish pennant pattern is made up of three key components that signal the continuation of an uptrend.
3 Main Parts
- The Flagpole (Initial Uptrend): This pattern starts with a strong upward price movement, shown by higher highs and higher lows. This rally forms the flagpole, demonstrating the initial bullish push.
- The Pennant (Consolidation): After the flagpole, prices enter a brief period of consolidation, creating a small triangle with trendlines that converge.
- The Breakout: The final stage happens when the price breaks above the pennant's upper trendline. This is often accompanied by higher trading volume, confirming the uptrend's continuation.
Key Elements to Watch
To confirm a bullish pennant pattern, traders should look for these features:
- Clear Uptrend: The pattern must follow a well-defined upward price movement.
- Symmetrical Triangle: The consolidation phase should form a compact triangle with converging trendlines.
- Volume Behavior: Volume typically decreases during consolidation and spikes during the breakout.
- Price Movement: The initial rally should show higher highs and higher lows.
Confirming these details can help traders avoid common mistakes.
Avoiding Common Errors
Even with the right elements, traders can still misinterpret the pattern. Here is how to steer clear of common errors:
| Mistake | Solution |
|---|---|
| Entering Too Early | Wait for a confirmed breakout before taking action. |
| Misidentifying Patterns | Ensure trendlines converge to form a symmetrical triangle. |
| Ignoring Volume | Watch for reduced volume during consolidation and a surge during the breakout. |
| Overlooking Market Context | Always consider broader market trends for a clearer picture. |
For example, in a EUR/USD daily chart, prices retraced about 50 percent of the flagpole after an initial rally. Once the upper trendline was broken, the uptrend resumed. This demonstrates how accurately identifying the pattern can lead to better trading decisions.
This structure provides a clear guide to spotting bullish pennants in live markets.
How to Find Bullish Pennants
Here is a simple guide to spotting bullish pennants.
Step 1: Spot the Flagpole
Look for a strong upward price movement, often called the flagpole. This should include higher highs, higher lows, and be accompanied by strong trading volume.
Step 2: Identify the Pennant
Next, locate the consolidation phase that forms the pennant. A valid pennant typically displays these characteristics:
| Feature | Details |
|---|---|
| Price Action | Trendlines converging into a symmetrical triangle shape |
| Volume | Noticeably lower trading volume during the consolidation phase |
| Size | A smaller price range compared with the initial flagpole |
"Pennants are continuation patterns where a period of consolidation is followed by a breakout used in technical analysis."
– Investopedia
Once you have identified both the flagpole and the pennant, the next step is to monitor for a breakout.
Step 3: Confirm the Breakout
A breakout is confirmed when:
- The price breaks and closes above the pennant's upper trendline.
- There is a clear increase in trading volume during the breakout.
"The breakout is driven by renewed buying interest, pushing the price to rally further. This point is crucial and is often accompanied by increased trading volume, reinforcing the pattern's validity and indicating that the asset's upward trend will probably continue."
– Zorrays Junaid, Market Analyst
For added confirmation, wait for a candle to close above the pennant before entering the trade.
Trading Steps and Rules
Bullish pennants require clear entry and exit strategies. Here is a helpful breakdown:
| Component | How to Calculate | Example |
|---|---|---|
| Entry Point | Wait for a close above the pennant's resistance | Buy at $52.75 after a confirmed breakout |
| Profit Target | Measure the flagpole's height (uptrend before the pennant) | If the flagpole = $10, target = entry + $10 |
| Stop Loss | Place just below the pennant's low or near its resistance line | If the low = $50.25, stop ≈ $50.00 |
Before entering, confirm these signals:
- Price Break: A clear breakout above the upper trendline of the pennant.
- Volume Increase: Look for a noticeable surge in volume during the breakout.
- Candle Close: Ensure the candle closes fully above the resistance level.
These steps should align with your broader risk-management plan.
Risk Control Methods
Managing risk is key to protecting your capital. Place your stop loss slightly below the pennant's resistance or low to limit losses if the breakout fails or the market reverses. Your position size should depend on the maximum amount you are willing to risk per trade:
| Account Size | Max Risk Per Trade (1%) | Position Sizing Formula |
|---|---|---|
| $25,000 | $250 | Risk ÷ (Entry – Stop) determines shares |
| $50,000 | $500 | Risk ÷ (Entry – Stop) determines shares |
| $100,000 | $1,000 | Risk ÷ (Entry – Stop) determines shares |
Use position-sizing calculators or tools to ensure your trades fit within these parameters.
LuxAlgo Trading Tools
LuxAlgo provides versatile tools to refine your bullish pennant trading strategy:
Price Action Concepts (PAC) Toolkit
- Automatically detects potential pennant patterns.
- Sends real-time alerts for breakouts, so you stay on top of opportunities.
- Offers customizable settings to confirm key price and volume movements.
Screener Integration
- Filters symbols showing pennant formations.
- Monitors multiple timeframes at once.
- Delivers instant notifications when patterns are complete.
Using LuxAlgo Features
Pattern Scanner Setup
To configure the LuxAlgo PAC toolkit for bullish pennant patterns, use the following settings:
| Setting | Configuration | Purpose |
|---|---|---|
| Pattern Type | Pennant / Flag | Targets continuation patterns |
| Timeframe | 1H – 4H | Best suited for identifying pennant formations |
| Volume Filter | Enabled | Verifies active trading volume |
| Alert Type | Push + Email | Ensures timely notifications for breakouts |
Additionally, adjust these parameters to fine-tune your scanner:
- Trend Strength: Set a minimum threshold to ensure strong uptrends are captured.
- Pattern Size: Define acceptable ranges for price consolidation.
- Breakout Level: Establish thresholds for confirming price movements.
Once these configurations are in place, validate your setup using LuxAlgo's AI-powered backtesting tools.
Testing with AI Tools
LuxAlgo's AI Backtesting Assistant allows you to test bullish pennant strategies without risking actual funds. Using its Step & Match algorithm, it evaluates entry and exit conditions. A recent update (December 2024) introduced the "Invalidate On Any Repeated Step" feature, which helps reduce false signals.
"The PAC Backtester is an innovative strategy script that allows users to create a wide variety of strategies derived from price-action-related concepts for a data-driven approach to discretionary trading strategies."
Set up your backtesting with these parameters:
- Entry Conditions: Confirm breakouts, validate volume surges, and verify trend strength.
- Exit Rules: Define profit targets, set stop-loss levels, and account for pattern failure.
- Risk Management: Adjust position sizing, set maximum drawdown limits, and establish win-rate benchmarks.
You can refine your strategy even further by tapping into community resources and expert insights.
Learning Resources
Expand your knowledge of bullish pennant trading by engaging with the LuxAlgo community through:
- Strategy Forum: Share and discuss ideas with experienced traders.
- Live Webinars: Learn advanced techniques for identifying patterns.
- Trading Templates: Access ready-made setups for bullish pennant strategies.
The PAC Backtester, combined with market-structure analysis and indicator integration, provides a comprehensive toolkit for building data-driven trading strategies. These tools help you create a complete workflow for effectively trading bullish pennant patterns.
Summary
Here is a quick overview of the key points and trading guidelines for bullish pennants.
Pattern Basics Overview
A bullish pennant includes three main components: a strong upward move (flagpole), a short consolidation phase (pennant), and a breakout confirmed by increased volume.
Key characteristics:
- A strong upward trend leading into the pattern
- Converging trendlines during the consolidation phase
- Reduced volume during consolidation
- A noticeable volume spike at the breakout
Trading Guidelines
| Component | Guidelines |
|---|---|
| Entry Timing | Enter only after a confirmed breakout |
| Stop Loss | Set below the lowest point of the pennant |
| Take Profit | Measure the flagpole height and project it from the breakout |
| Volume Check | Exit if the breakout is not supported by higher volume |
Using LuxAlgo for Bullish Pennants
To incorporate LuxAlgo's tools into your trading strategy, consider these steps:
- Set up the PAC toolkit with parameters tailored for pennants.
- Use the AI Backtesting Assistant to validate your approach.
- Configure custom alerts to notify you of breakouts.
- Track patterns using the Pattern Scanner.
- Engage with the Strategy Forum to gain additional insights and tips.
FAQs
How can I tell the difference between a bullish pennant and other similar chart patterns?
A bullish pennant is distinct due to its formation and the context in which it appears. It occurs during an uptrend and is marked by a strong upward move (the flagpole) followed by a brief consolidation phase that forms a small symmetrical triangle with converging trendlines.
To identify it effectively, look for these key traits:
- Trend Continuation: The pattern emerges during an existing uptrend and typically signals the trend will continue.
- Breakout Direction: After the consolidation, the price breaks out upward, resuming the uptrend.
- Volume Behavior: Volume usually decreases during the consolidation and spikes during the breakout.
In comparison:
- Flags have parallel trendlines during consolidation, unlike the triangular shape of a pennant.
- Wedges slope against the prevailing trend, while pennants are neutral and smaller in size.
By focusing on these characteristics, you can confidently distinguish bullish pennants from other patterns and incorporate them into your trading strategies.
What are the best ways to manage risk when trading a bullish pennant pattern?
Managing risk effectively is essential when trading a bullish pennant pattern. Here are a few key strategies:
- Set a stop-loss: Place your stop-loss just below the lowest point of the pennant to limit potential losses if the pattern fails. This ensures you exit the trade before losses grow too large.
- Confirm the breakout: Wait for a clear breakout above the pennant's upper boundary before entering a trade. This helps avoid false breakouts and increases the likelihood of a successful trade.
- Use a favorable risk-reward ratio: Aim for a risk-reward ratio of at least 1:2, meaning your potential profit should be at least double your potential loss. This helps ensure long-term profitability.
By combining these practices with disciplined position sizing and careful market analysis, you can trade this pattern with greater confidence and control.
How can I use LuxAlgo's tools to trade bullish pennant patterns more effectively?
LuxAlgo's tools can significantly simplify trading bullish pennant patterns by providing automated insights and actionable data. The Price Action Concepts toolkit identifies market structure and highlights key support and resistance levels, helping you spot patterns with precision. Additionally, the Signals & Overlays feature delivers customizable trading signals and alerts, ensuring you stay informed about potential opportunities.
For deeper analysis, the Oscillator Matrix offers trend-following and divergence indicators, giving you a comprehensive view of market momentum. By combining these tools, you can enhance your strategy, improve decision-making, and trade bullish pennant patterns with greater confidence.


