Relative Vigor Index to Judge Bull Bear Balance
The Relative Vigor Index (RVI) compares the close-to-open movement with the high-to-low range, then smooths the result to describe bullish or bearish momentum. Its main line oscillates around zero. A separate signal line helps define changes in that momentum, but neither line predicts the next price move with certainty.
This guide covers the weighted calculation, crossovers, divergence, indicator combinations, timeframe selection and risk controls. RVI here means Relative Vigor Index, not the different Relative Volatility Index that shares the abbreviation.
Use Quant Charts to inspect market context and Quant, our coding agent, to help implement and test a precisely defined RVI strategy. LuxAlgo’s native momentum tools and TradingView toolkits can provide separate comparisons; they should not be assumed to use the RVI formula.
How the Relative Vigor Index Works
RVI Calculation Formula
Start with open, high, low and close data from the same instrument, session and chart interval. The unsmoothed relationship is (Close − Open) ÷ (High − Low). A bar closing above its open contributes positively; a bar closing below its open contributes negatively. Unlike a close-to-close return, this quantity does not directly include the gap from the previous close.
The MetaTrader 5 RVI documentation describes a four-bar symmetric weighting of 1–2–2–1 for both the numerator and denominator. A common implementation then averages each weighted series over N periods, often 10, before taking their ratio. Define the calculation explicitly rather than assuming every platform uses identical smoothing.
| Component | Explicit calculation | Interpretation |
|---|---|---|
| Bar movement d(t) | Close(t) − Open(t) | Signed candle body |
| Bar range r(t) | High(t) − Low(t) | Total high-to-low range |
| Weighted movement A(t) | [d(t) + 2d(t−1) + 2d(t−2) + d(t−3)] ÷ 6 | Four completed bars, with greater weight on the middle two |
| Weighted range B(t) | [r(t) + 2r(t−1) + 2r(t−2) + r(t−3)] ÷ 6 | The same weights applied to range |
| Main RVI | SMA(A, N) ÷ SMA(B, N) | Ratio of smoothed series, not the average of individual bar ratios |
| Signal line | [RVI(t) + 2RVI(t−1) + 2RVI(t−2) + RVI(t−3)] ÷ 6 | Symmetrically weighted average, not a simple four-period average |
The division by six cancels between the main numerator and denominator if both are otherwise treated identically. Likewise, sums over the same N bars give the same ratio as their simple averages. Averaging each bar’s body/range ratio first is generally a different calculation.
For a simple check, suppose each of the required bars has a close-to-open change of 2 and a high-to-low range of 5. The weighted and smoothed series remain 2 and 5, so the main RVI is 0.40. If the latest four RVI values are 0.20, 0.10, 0.00 and −0.10, the signal is (0.20 + 2 × 0.10 + 2 × 0.00 − 0.10) ÷ 6 = 0.05. Their simple average would also be 0.05 in this particular example, so use unequal curvature to test the distinction: 0.40, 0.10, 0.00 and 0.00 produce a weighted signal of 0.10 versus a simple average of 0.125.
Specify a zero-denominator policy and enough warm-up history. With conventional trailing windows, N=10 needs 13 bars for the first fully populated main value and 16 for the first four-value signal. Initialization rules can differ, so compare the implemented series with a reference before testing entries.
Understanding the Signal Line
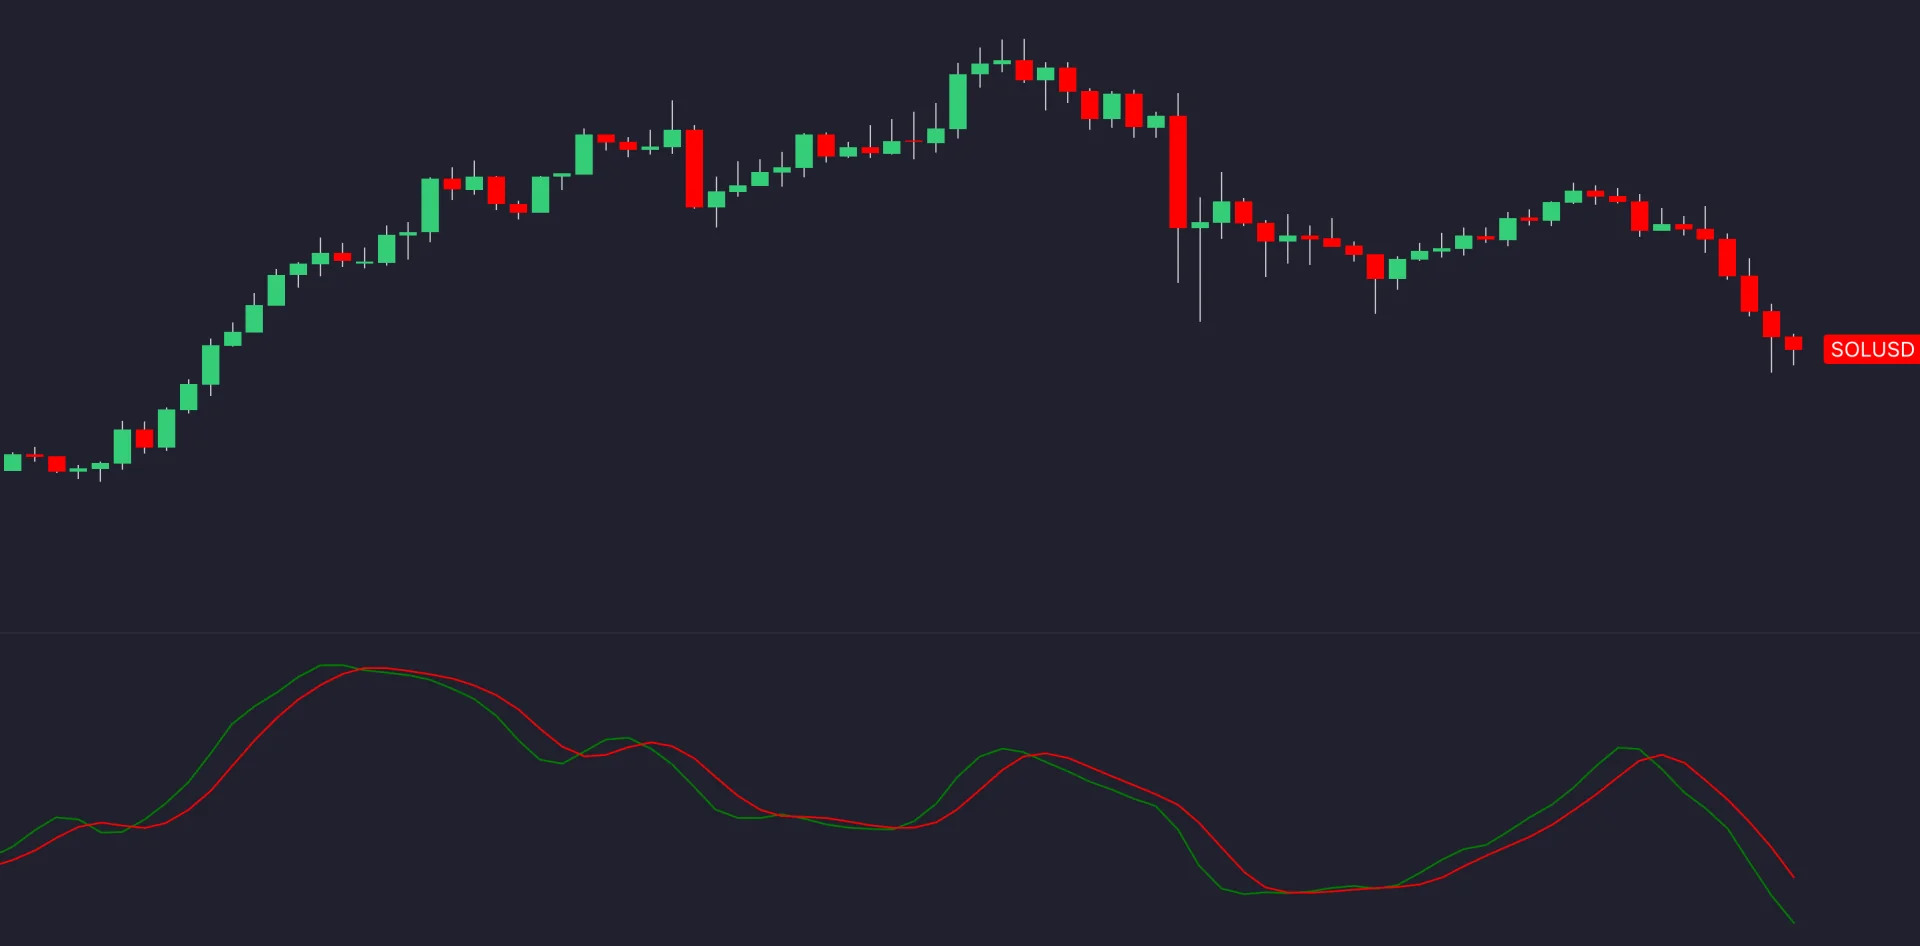
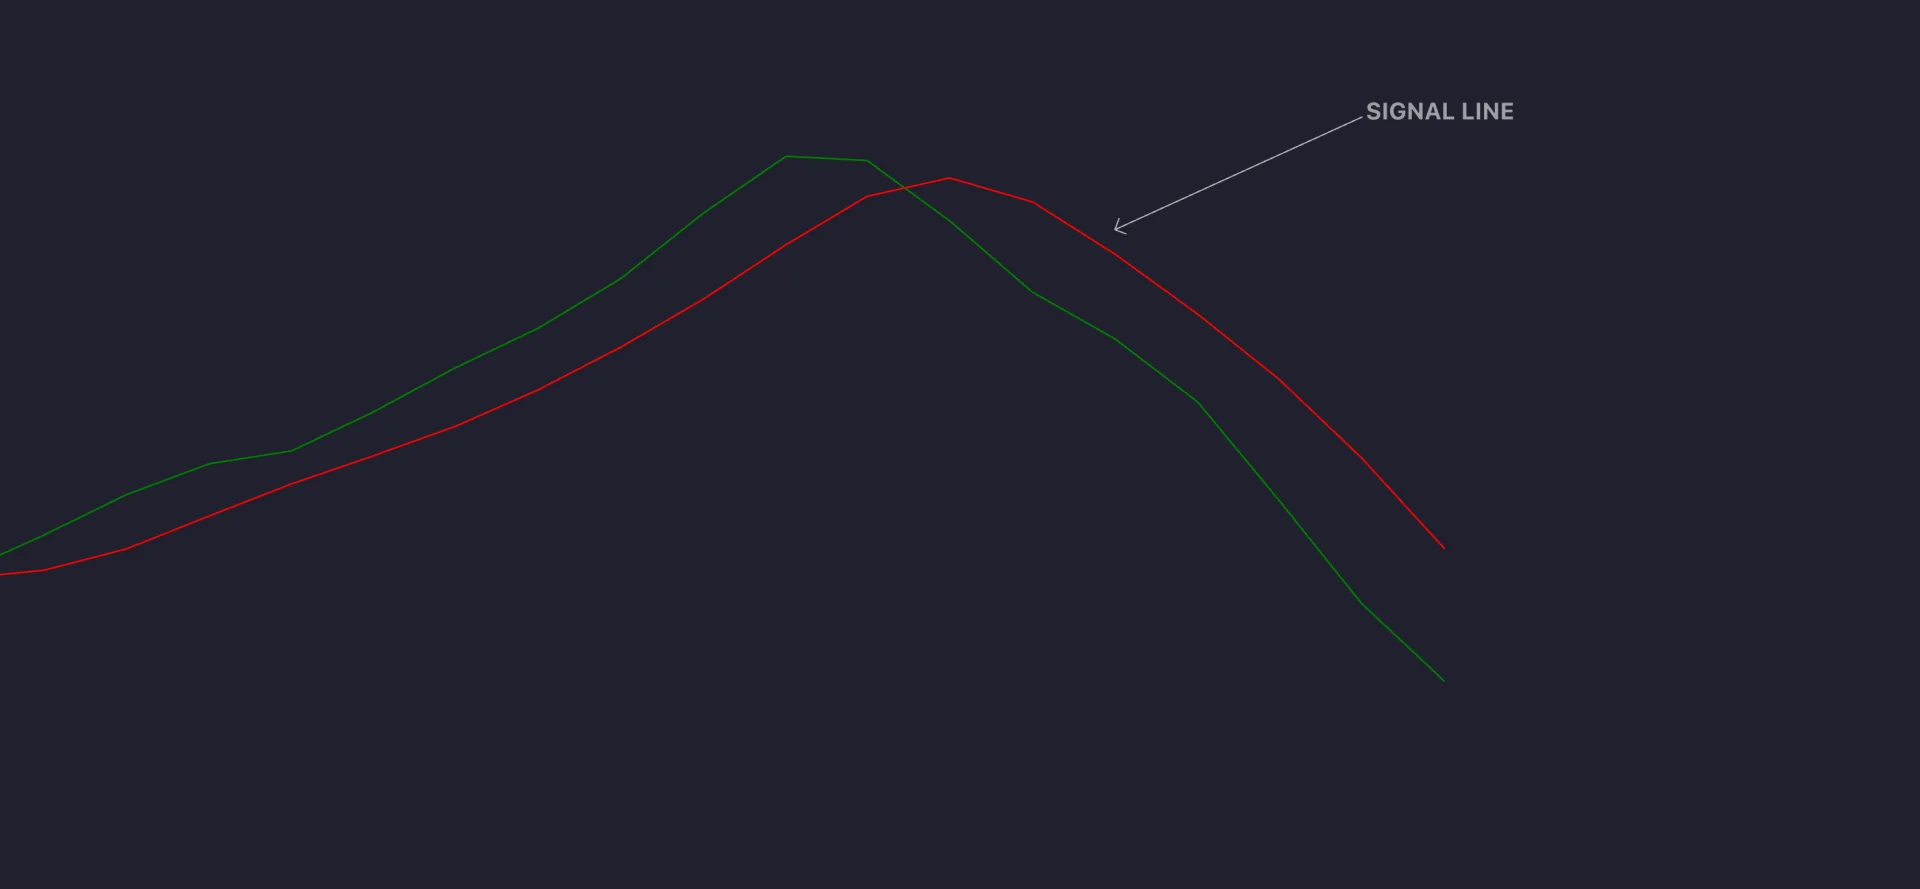
A bullish crossover occurs when the main RVI moves above its signal after being at or below it; a bearish crossover reverses that relationship. These events describe relative movement between two smoothed series. A bullish cross can occur below zero while the broader reading remains negative, and a bearish cross can occur above zero.
The signal line adds smoothing and usually responds more slowly. Its green/red colors are display choices, not part of the formula. Use completed bars if that is the strategy’s rule; a developing crossover can disappear before the candle closes.
Reading RVI Values
Positive RVI indicates a positive smoothed close-to-open balance; negative RVI indicates the opposite. It is not a count of bullish versus bearish traders. For valid OHLC data and nonnegative weights, the body’s absolute size cannot exceed the high-to-low range, which keeps this version within −1 to +1 when the denominator is positive. Some displays scale the result differently.
Readings such as +0.40 and −0.40 are possible reference levels, not universal overbought and oversold thresholds. A positive RVI can coexist with falling close-to-close prices if gaps dominate. The slope describes changes in the oscillator, not an independently measured trend strength or guaranteed price acceleration.
Bearish divergence occurs when a selected price high rises while the corresponding RVI high falls; bullish divergence uses a lower price low and higher oscillator low. Define how the pivots are selected and when they confirm. Divergence may persist through a trend and does not by itself establish a short or long entry.
Using RVI in Trading Strategies
RVI Entry and Exit Signals
A testable baseline might enter long after a completed bullish crossover and exit after a bearish crossover, with explicit protective-stop and maximum-holding rules. A separate short model could reverse the conditions. Specify the first permitted execution price after confirmation, position limits and whether immediate reversal is allowed.
A zero-line filter is a different hypothesis: requiring RVI above zero for long entries changes the eligible trades and may delay them. A divergence model needs its own confirmation and entry trigger. Do not silently combine the best historical examples from these models into one claimed track record.
Ranging conditions can generate repeated crossovers without sustained follow-through. Trending conditions can also produce losing trades or late reversals. Evaluate the model across both instead of assuming RVI universally works best in one regime.
Combining RVI with Other Indicators
Additional indicators can impose useful conditions, but they also remove trades and can repeat information already present in price. Compare each filter against the same baseline, data and risk budget. A higher win rate with much lower opportunity is not automatically an improvement.
| Combination | Illustrative rule to test | Important distinction |
|---|---|---|
| Classic RSI | RSI below 30 plus a completed bullish RVI crossover; reverse with RSI above 70 for shorts | A reversal hypothesis. RSI extremes can persist; do not substitute Ultimate RSI without retesting |
| 9/16 simple moving averages | Require the 9-period SMA above the 16-period SMA for longs, or require an actual bullish cross | State versus crossover event are different conditions; define their order and time window |
| Bollinger Bands | Use a close across the middle line, commonly a 20-period SMA, with an RVI condition | The middle-line cross is not proof of an overbought/oversold reversal |
| Stochastic Oscillator | Use a predefined Stochastic threshold and RVI crossover | Stochastic measures close location in a high-low window; agreement is not independent proof |
| Structure and levels | Require a completed price break or proximity to predefined support/resistance | RVI itself does not break price structure; overlapping levels do not supply a calibrated probability |
The moving-average guide and Bollinger Bands guide provide related context. Define exit rules separately: an opposite RVI cross, moving-average cross and middle-band cross will not necessarily happen together.
Multi-Timeframe RVI Analysis
A trader studying a 15-minute entry chart might use a one-hour or four-hour chart for broader context. For example, require the last completed hourly RVI above zero before considering a 15-minute bullish crossover. Record whether a later change in hourly state closes the trade or only prevents new entries.
Only use the higher-timeframe information available at the decision. The final hourly reading cannot be assigned to all four earlier 15-minute bars. Confirmed divergences can need additional bars as well. Respect both delays in historical tests.
Support/resistance clusters and a price-structure break can be separate contextual conditions. LuxAlgo’s Market Structure Oscillator offers a distinct structure workflow. Its markers are not RVI values, and retrospective swing displays should not be treated as signals available at their plotted origin.
Research Momentum Strategies with LuxAlgo
Compare Native Momentum Tools on Quant Charts
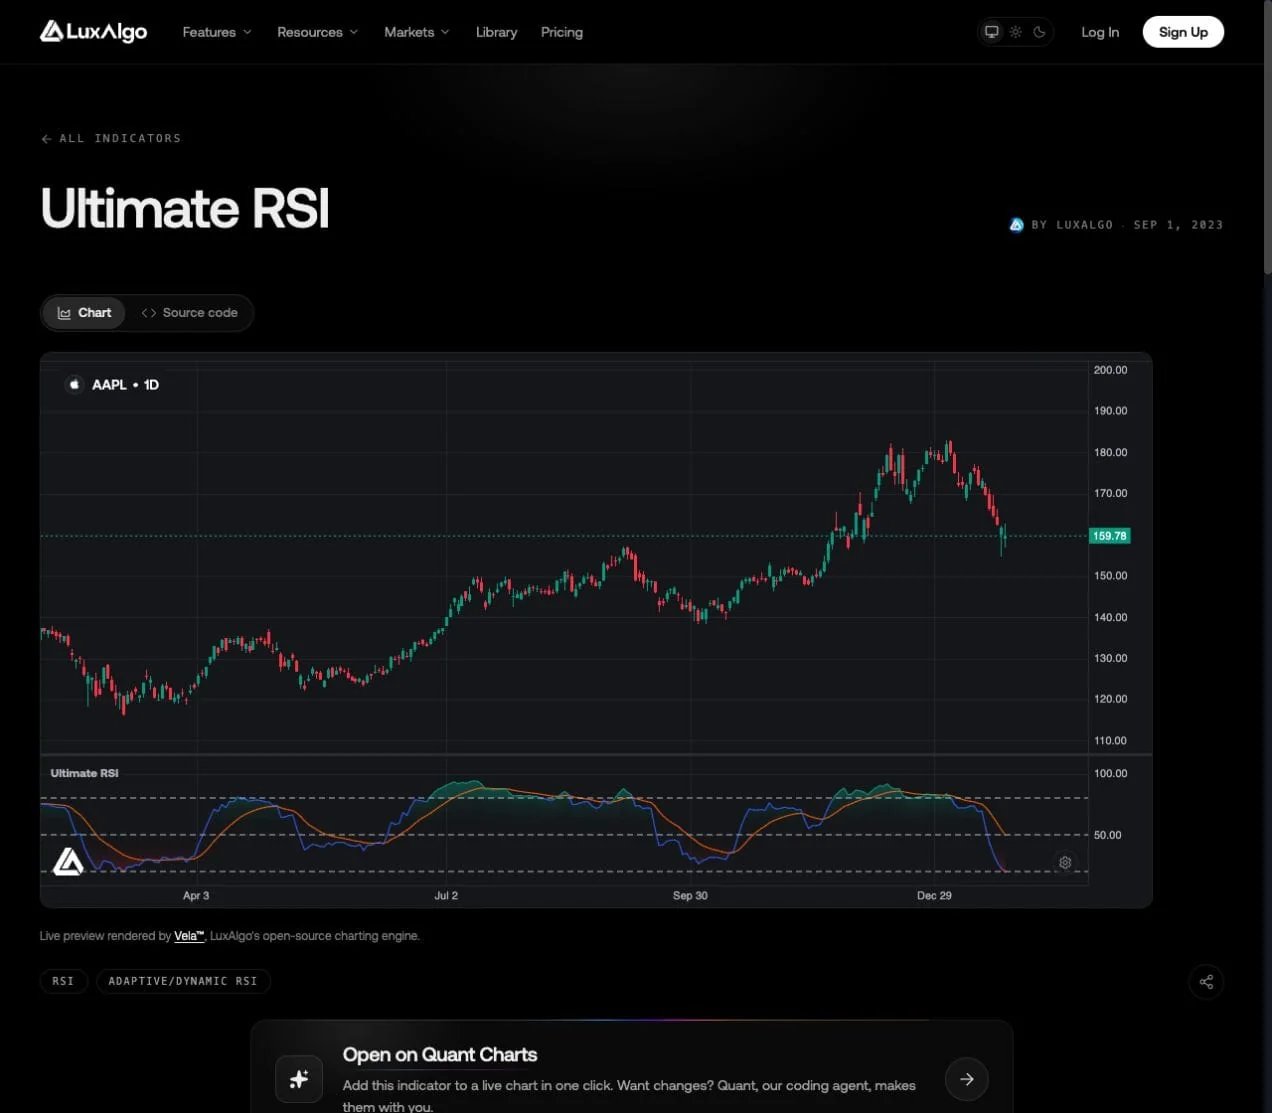
Ultimate RSI is a separate native Library indicator designed around trend momentum. Its calculation gives greater influence to movements making new rolling highs or lows. It can hold extreme readings through sustained moves, so an overbought reading is not automatically a sell instruction.
The native Library preview can be opened on Quant Charts. Its documented controls include Length, Source, oscillator smoothing Method, signal Smooth and signal Method. Do not present it as the Relative Vigor Index or assume its thresholds match classic RSI. A useful comparison tests RVI alone, Ultimate RSI alone and a clearly specified combination.
Implement the Formula and Rules with Quant
Ask Quant to help implement the chosen RVI formula, including 1–2–2–1 weights, N-period smoothing, zero-range handling and signal initialization. Specify the crossover, next permitted fill, stop, target, holding limit and risk cap. Inspect Code and click Run yourself, then review individual trades against the chart.
Use Making Strategies with Quant and the native backtest guide to understand the workflow. Verify available inputs and runtime support rather than assuming that every visible Library indicator is directly callable from a strategy.
RVI Optimization Techniques
Adjusting RVI Period Settings
Ten periods is a common starting point, not a universally optimal value. Shorter windows usually respond more quickly and produce more fluctuations; longer windows smooth the series while increasing delay. The four-bar weighting and signal smoothing still affect timing after the main period changes.
Daily charts can make manual review manageable, but they do not guarantee more reliable signals. Choose data appropriate to the intended holding period and session. A longer period is not automatically preferable in volatile markets, nor a shorter one in stable trends.
Filtering RVI Signals with Volatility
ATR measures range-based volatility, not direction or signal accuracy. Define a filter as a reproducible condition, such as ATR relative to price or its own trailing history. Test whether it improves net results. Low volatility can also mean choppy, unprofitable crossover trading, so it is not evidence that RVI signals are more dependable.
Volume may add context, but compare like-for-like feeds: forex tick activity and consolidated equity trade volume are different measurements. A bullish cross on declining volume is a condition to investigate, not an automatic rejection. Narrow price movement around a moving average can also produce repeated signals.
Keltner Channels generally use an ATR-based envelope while Bollinger Bands use a dispersion-based envelope. Their relative smoothness depends on settings and data. The band-indicator guide explains related approaches.
Backtesting RVI Strategies
Begin with a few instruments and manually reconcile a sample of signals. One to two years of daily/four-hour data or three to six months of intraday data may be an initial workflow check, but calendar length alone does not establish reliability. Evaluate trade count, market regimes, sessions and an untouched chronological test period.
Include commissions, spread, slippage and realistic order timing. Record missed limit fills and gaps. Average bars held helps describe turnover and exposure, but does not by itself establish whether a high-frequency strategy is feasible.
Review net expectancy, average win/loss, drawdown, exposure and performance by period. An arbitrary exposure ceiling such as 70% is not a universal risk standard. Position sizing needs account risk, stop distance, instrument value, leverage and portfolio correlation.
The previously cited GLD figures of 0.44% average gain and 51% wins lack a reproducible rule set, date range and cost assumptions here. They should not be treated as verified evidence of an RVI edge. If evaluating an external backtest, reproduce its rules and distinguish gross from net results before drawing a conclusion.
Compare nearby parameter values and use training, validation and untouched testing periods in chronological order. Repeatedly selecting the best result on the same history can fit noise. Follow with paper forward testing, recording decisions as new data arrive, rather than assuming a successful backtest ensures future profitability.
A Worked RVI Risk Example
Suppose a completed bullish crossover permits a stock entry at $80, with a stop at $78 and target at $84. On a $20,000 account, an illustrative 0.5% planned risk budget is $100. This is a sizing example, not an observed profitable trade.
| Item | Calculation | Practical meaning |
|---|---|---|
| Quantity | $100 ÷ ($80 − $78) = 50 shares | $100 planned price risk and $4,000 position value |
| Target reward | 50 × ($84 − $80) = $200 | 2R gross reward |
| Stop executes at $77 | 50 × ($80 − $77) = $150 loss | 1.5R before fees despite the planned stop |
| Entry instead fills at $81 | ($84 − $81) ÷ ($81 − $78) = 1R | Recalculate size: floor($100 ÷ $3) = 33 shares, $99 planned risk |
At 40% wins averaging 2R and 60% losses averaging 1R, gross expectancy is +0.20R per trade. Costs of 0.10R reduce it to +0.10R. A target ratio does not establish that realized wins will reach it. Futures and forex also require contract/point values and currency conversion.
Investor.gov’s order guide explains that stop execution prices are not guaranteed and limit orders may remain unfilled. Cap total correlated exposure, account for gaps and keep the risk rule distinct from the oscillator exit.
Key Takeaways and Conclusion
Main Points About RVI
RVI measures a smoothed body-to-range relationship. The zero line, signal crossovers and divergence answer different questions. None directly measures institutional activity or provides advance knowledge of a reversal. Smoothing creates lag, and the indicator can generate losing signals in both ranges and trends.
Final Thoughts on RVI Trading
Use one explicit formula and a small set of rules, then investigate their behavior on Quant Charts and test implementation with Quant. Preserve failed signals in the analysis. Add RSI, moving averages, bands, volume or structure only when their role is defined and their contribution survives a fair comparison.
Keep a record of the chart, settings, signal time, execution and outcome. Distinguish coding and execution errors from trades that followed the rules and lost. Change the model through a documented test rather than adjusting it to explain each result afterward.
Relative Vigor Index Trading Strategy: Video Example
The retained video illustrates one RVI strategy. Its historical results depend on its particular rules, instrument and test conditions; they are not a performance promise for another implementation.
FAQs
How does RVI differ from RSI and Stochastic?
Relative Vigor Index compares close-to-open movement with high-to-low range using smoothing. Classic RSI compares smoothed gains and losses, while Stochastic measures the close within a recent high-low window. Their settings and timing differ; no universal reliability or lag ranking follows from those definitions.
Is the RVI signal line a simple four-period average?
In the weighted implementation described here, it uses weights 1–2–2–1 divided by six. That differs from giving each of the four values equal weight. Check the formula used by the actual platform.
Are +0.40 and −0.40 fixed overbought and oversold levels?
No. They can be chosen as research thresholds, but their usefulness depends on the instrument, interval and strategy. A sustained extreme is not an automatic reversal signal.
How should beginners backtest RVI?
Define the formula and complete trading rules, reconcile individual signals, include costs and execution timing, and use chronological out-of-sample evaluation. A fixed number of months or years alone does not prove reliability.
How can RVI be used in sideways markets?
Expect possible repeated crossovers without follow-through. Compare the baseline with explicit trend or volatility filters and account for the trades they remove. More smoothing can reduce fluctuations while delaying signals; it does not guarantee better results.
Can LuxAlgo Ultimate RSI replace RVI without changing a strategy?
No. Ultimate RSI is a different trend-oriented oscillator. Inspect it on Quant Charts and test it as a separate model or an explicitly defined filter. Use Quant to help implement the required RVI formula, inspect Code and click Run.
References
LuxAlgo Resources
- Quant Charts
- LuxAlgo Quant
- Ultimate RSI
- Making Strategies with Quant
- Native Backtest Guide
- Market Structure Oscillator
- Understanding Moving Averages
- Bollinger Bands: Squeeze then Surge
- Band Indicators and Volatility
External Resources
Read next