Mean Reversion Trading: Fading Extremes with Precision
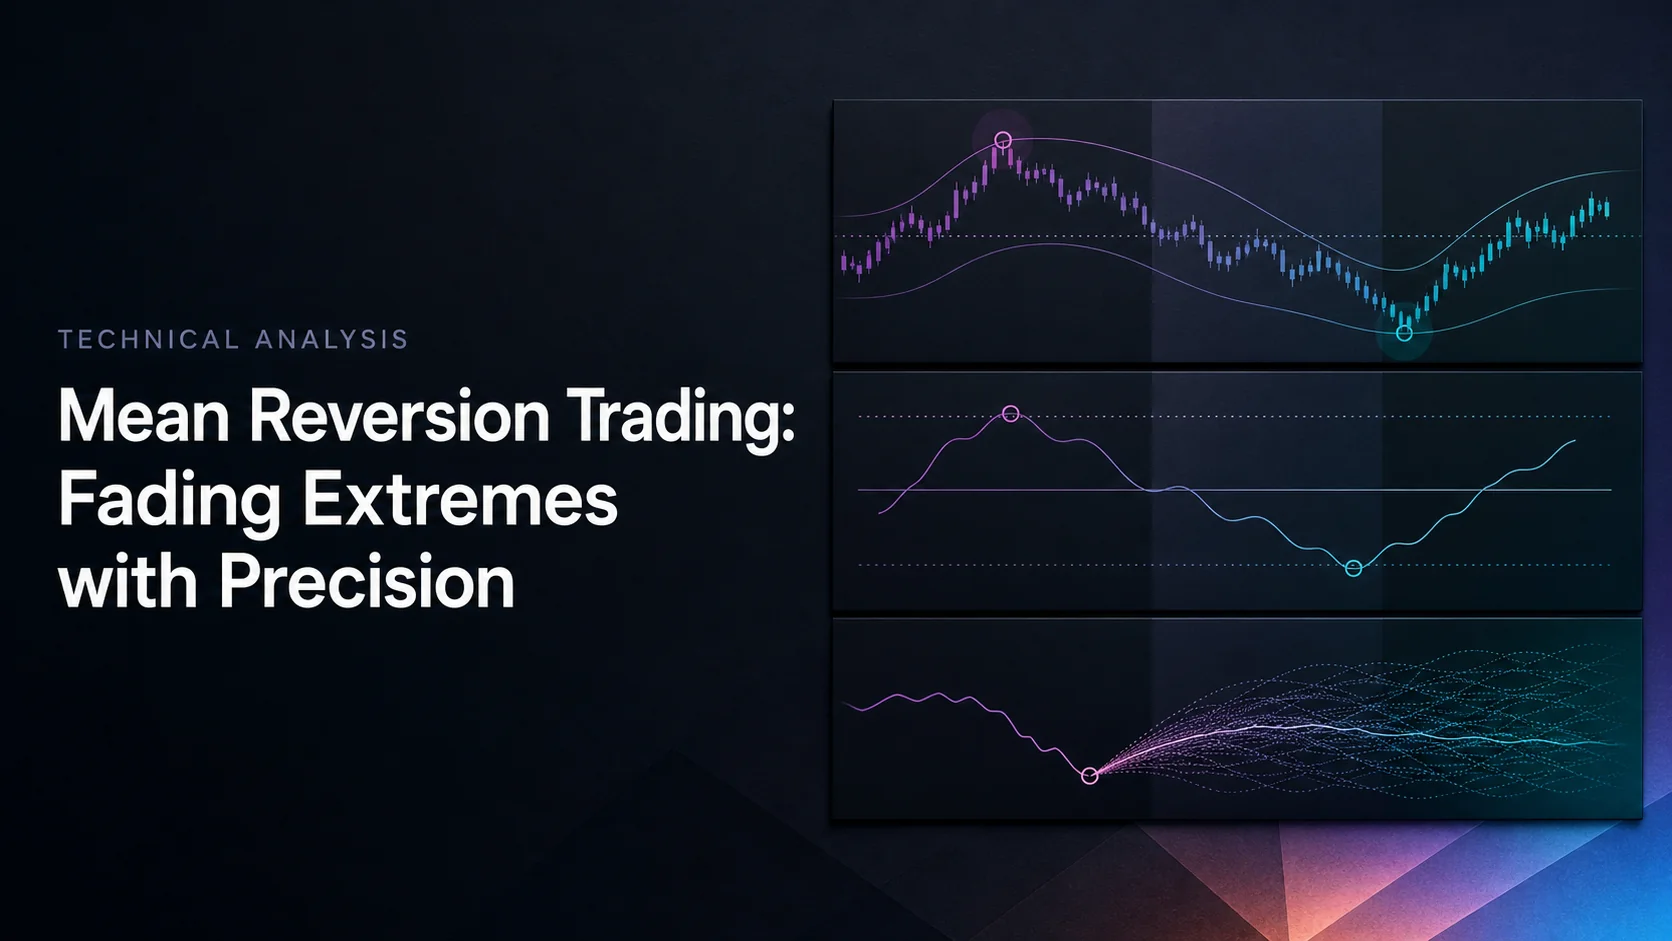
Mean reversion trading tests whether a price stretched away from a defined reference will move back toward it. The reference might be a moving average, a session VWAP or another specified benchmark. A large deviation identifies a condition to investigate, not a promise that price will recover before the stop is reached.
This guide develops a Bollinger Bands, RSI and volume example, then defines entries, exits and position size. Use Quant Charts to inspect the setup and Quant, our coding agent, to help implement and test its rules. Native Library tools and separate TradingView toolkits can add context, but their calculations and supported inputs need to be checked individually.
The central risk is that an apparent extreme becomes a persistent trend or the reference mean changes. A high historical win rate can conceal occasional large losses. Neither mean reversion nor trend following has a universal win rate, holding period or best market.
| Approach | What it tests | Holding period | Typical failure to investigate |
|---|---|---|---|
| Mean reversion | Movement back toward a specified reference after a deviation | Two to ten days is one swing-trading example; intraday and longer models also exist | A continued trend, gap or changing mean |
| Trend following | Persistence after a directional condition | Determined by entry and exit rules, not necessarily longer than every reversion trade | Repeated false starts in a range |
Range-bound behavior can suit some fading strategies, but it must be identified without hindsight. High volatility also creates execution and gap risk. For a related treatment of entries and staged exits, see the Mean Reversion Playbook.
Mean Reversion Strategy Video
The existing video offers additional strategy examples. Treat any rules or historical results as specific to their instruments, timeframes and execution assumptions.
Finding Price Extremes
Bollinger Bands Setup
A conventional setup uses a 20-period simple moving average with upper and lower bands two standard deviations away. The average and dispersion change as new observations enter the window. Specify the source, lookback and standard-deviation convention if reproducing the calculation in code.
If the average is 100 and the standard deviation is 2, the bands are 104 and 96. A price of 95 is 2.5 standard deviations below that reference: (95 − 100) ÷ 2 = −2.5. The statistic describes distance under that calculation; it is not a probability of a profitable rebound.
John Bollinger’s rules warn against assuming a normal price distribution or interpreting a band tag as a standalone buy or sell signal. Prices can follow a band through a sustained trend. A close outside the band can support continuation rather than reversal.
| Observed condition | Possible interpretation | Decision still required |
|---|---|---|
| Touch or close above the upper band | High price relative to the selected window | Fade, wait for re-entry, follow the breakout or do nothing |
| Touch or close below the lower band | Low price relative to the selected window | Check the chosen entry confirmation and exit criteria |
| Price within the bands | Within the current envelope | There may still be a setup under other rules; band location alone is incomplete |
Do not assume the bands contain 95% of market prices merely because they use a two-standard-deviation multiplier. The usual normal-distribution interpretation does not establish containment or future return probabilities for rolling market prices. Twenty periods and a multiplier of two are starting settings, not universal optima. See the band-indicator guide for related approaches.
RSI Signal Analysis
Classic RSI measures the balance of smoothed gains and losses. Values above 70 and below 30 are common reference thresholds, but extremes can persist. The StockCharts RSI guide explains why trend context matters: an elevated reading does not require immediate selling, nor a low reading immediate buying.
The original idea of RSI below 30 alongside a lower-band extreme is a testable long hypothesis; RSI above 70 alongside an upper-band extreme gives a corresponding short hypothesis. Neither is confirmation that a reversal has started. RSI behavior can shift with market direction, so ranges such as 40–70 or a ceiling near 60 should not be treated as fixed boundaries.
Ultimate RSI uses a different trend-oriented calculation. It can sustain extreme readings through trends and should not replace classic RSI in a 30/70 rule without a separate test. Multiple momentum indicators can repeat similar information rather than provide independent evidence.
Volume Analysis
A volume spike near an extreme may accompany exhaustion, continued repricing or a news-driven breakout. Declining volume can accompany weaker participation, but it does not prove the move is ending. Treat both observations as measurable filters and compare their contribution with the price-only baseline.
Define the volume benchmark. On daily bars, a rule could require completed daily volume at least 1.5 times the average of the preceding 20 completed daily bars. On an intraday chart, comparing a partial bar with an entire day’s volume is inconsistent; use completed comparable bars or a specified time-of-day baseline.
Know the feed as well. Forex tick activity, an individual crypto exchange and consolidated equity volume measure different populations. Volume at a prior high or low can supply context, but it does not identify participants or reveal why they traded.
Mean Reversion Strategy Steps
Entry Rules
The following daily-bar model makes the original entry idea reproducible. It is an illustrative research specification, not a validated profitable system. Calculate each condition on the completed signal bar, then allow execution only at the next permitted price.
| Condition | Long candidate | Short candidate |
|---|---|---|
| Price location | Close below the lower 20-period, two-deviation band | Close above the upper equivalent band |
| Classic RSI | Below 30 under the chosen RSI settings | Above 70 under the same settings |
| Volume filter | Completed volume ≥1.5× prior 20-bar average volume | The same comparable-volume rule |
| Deviation range | z-score between −3 and −2 | z-score between +2 and +3 |
The band condition and z-score condition share information when they use the same average and dispersion. The z-score range adds an outer boundary, but it is not a second independent confirmation. Define what happens beyond three deviations rather than discarding those trades after seeing their outcomes.
Compare immediate next-bar entry with a separate rule that waits for price to close back inside the band. Waiting may avoid some early fades while entering later or missing trades. Specify whether the next bar’s gap cancels the setup, changes quantity or permits an entry at a worse reward-to-risk ratio.
For a short version, include borrow availability, borrow costs and applicable trading restrictions. Do not assume that reversing the long formula produces symmetrical fills or risk. Avoid adding to a losing position unless a predefined total exposure and risk budget explicitly covers every addition.
Exit Methods
A target at the reference average is one option. Another exits part of the trade as price returns within 1–1.5 standard deviations and closes the remainder at the mean or on a time limit. Define the fraction, order type and reference used by each exit before testing.
Decide whether the mean is frozen at the signal or updated each bar. A falling mean can move toward a losing long position, so touching the updated mean does not guarantee the originally expected profit. The same issue applies to changing band widths and volatility targets.
A maximum holding period can close trades that fail to revert. Model what happens if a target and stop are both touched in one historical bar; OHLC alone may not reveal which came first. Use appropriate lower-timeframe evidence or an explicitly conservative fill assumption.
Risk Controls
Choose invalidation and an account risk budget before sizing. The basic stock formula is quantity = planned risk amount ÷ entry-to-stop distance, rounded down to the permitted lot size. Futures and forex require point or pip value, contract size and currency conversion.
A 1–2% budget is a commonly discussed example, not a universally safe allocation. Correlated positions can lose together, and actual losses can exceed the planned amount. Investor.gov’s order guide explains that a triggered stop becomes a market order whose execution price is not guaranteed.
ATR-based distances such as 1.5×ATR or 2×ATR are research choices. If stop distance increases from 1.5×ATR to 2×ATR while the risk budget stays fixed, quantity becomes 75% of its previous size. If distance doubles, quantity halves. A blanket 25–50% size reduction does not automatically preserve the intended risk in every volatility change.
Recalculate before entry. Widening an existing stop while retaining the same quantity increases planned loss. Review aggregate exposure, liquidity and margin as well as the per-trade percentage. Kelly-style sizing is highly sensitive to estimated probabilities and payoffs; a fractional approach does not eliminate estimation error or tail losses.
A Worked Mean Reversion Example
Suppose the completed signal bar has an average of $100, standard deviation of $2, close of $95, RSI of 25 and volume of 150,000 shares against a prior 20-bar average of 100,000. These values satisfy the illustrative long filters. The next permitted fill is $96, with a chosen stop at $93 and a frozen target at $100.
| Item | Calculation | Meaning |
|---|---|---|
| Budget | $20,000 × 0.5% = $100 | Illustrative planned price-risk allowance |
| Quantity | Floor($100 ÷ ($96 − $93)) = 33 shares | $99 planned risk and $3,168 position value |
| Frozen target reward | 33 × ($100 − $96) = $132 | Approximately 1.33R gross reward |
| Stop executes at $92 | 33 × ($96 − $92) = $132 loss | Approximately 1.33R loss before fees |
| Updated mean drops to $97 | 33 × ($97 − $96) = $33 gross gain | Only 0.33R if that updated reference becomes the target |
The example shows why the observed extreme, actual entry and target policy must be separated. It does not establish an edge. At 70% wins averaging 0.5R and 30% losses averaging 2R, expectancy is 0.70 × 0.5R − 0.30 × 2R = −0.25R before costs despite the high win rate.
LuxAlgo Tools for Mean Reversion
Inspect Breakout Pressure on Quant Charts
The native Bollinger Bands Breakout Oscillator summarizes movement beyond the bands as opposing bullish and bearish areas. It normalizes breakout-distance contributions over its lookback window. Its documented controls are Length, Mult and Src.
For a fading strategy, this can help investigate a competing hypothesis: is the apparent extreme part of persistent breakout pressure? Green or red dominance describes the calculation, not a reversal probability. Test an explicit filter against the unfiltered model rather than assuming smaller areas make a fade safe.
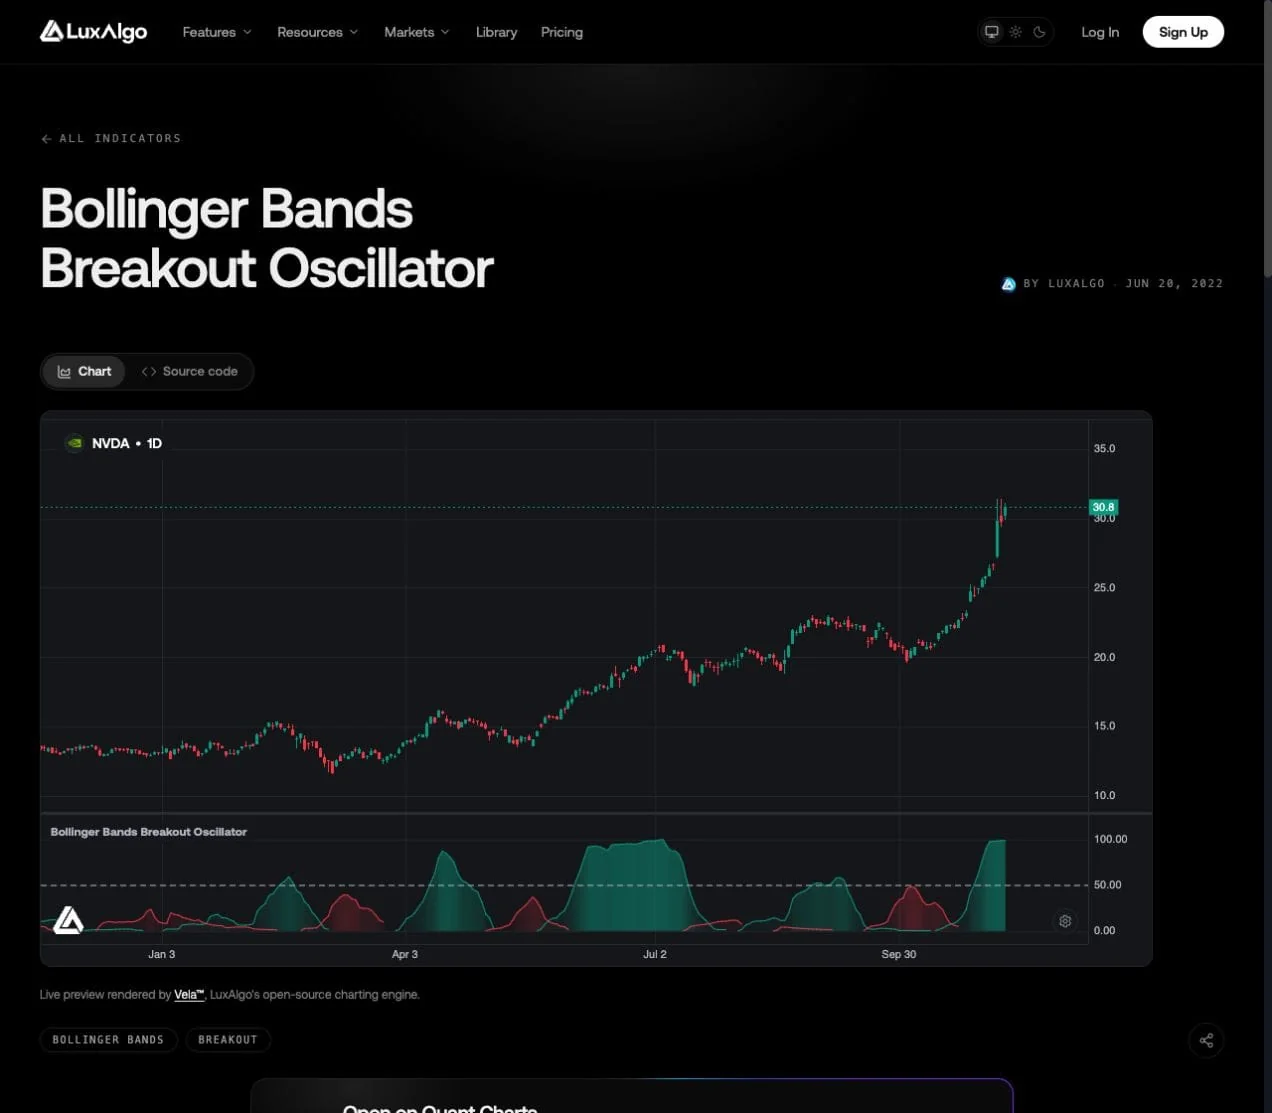
Open the native indicator from the LuxAlgo Library on Quant Charts. Keep the symbol, interval, data feed and settings recorded. Changing the band multiplier changes which moves qualify; the result is not interchangeable with classic RSI or a statistical z-score.
Divergence lines drawn on the price chart are positioned retrospectively; they are not detected exactly at those earlier plotted points. Use the actual detection time rather than assigning a historical entry at the beginning of the line.
An H4 context chart, H1 condition and 15-minute execution chart are possible analysis choices. They are not a documented guarantee that H4 confirms entries, H1 verifies institutional volume and 15 minutes optimizes exits. Define the role of each chart and use only completed higher-timeframe information available at the decision.
Price Action Tools on Quant Charts
The Library’s order-block and market-structure tools add a separate zone workflow on a Quant Chart. A zone can define a price reference or an invalidation level; it does not prove pending institutional orders or guarantee a reversal.
Check the chosen settings, mitigation rules and signal timing. Confluence between a zone, oscillator and band extreme should be evaluated as a complete rule. More overlays do not inherently create greater precision.
Build and Test the Rule with Quant
Ask Quant to help implement the defined mean, band calculation, RSI condition, comparable-volume filter, confirmation, execution, stop, target, time exit and size cap. Inspect Code and click Run yourself. Follow Making Strategies with Quant and the native backtest guide.
Check that the required data and indicator logic are available to the strategy runtime. A marker drawn by an indicator is not automatically a callable input.
Compare the baseline with each added filter using identical dates, costs and risk assumptions. Report trade count, net expectancy, average win/loss, drawdown, exposure and results by regime. Evaluate both missed opportunities and losing trades; a filter that raises win rate can still reduce net returns.
Keep training, validation and untouched testing periods chronological. Include spread, commissions, slippage and borrow costs where relevant. Inspect nearby parameter values and difficult transitions from ranges to trends. Paper forward testing then checks decisions as new data arrive; it does not make future outcomes certain.
Summary
Key Points
Mean reversion requires a defined reference, a measurable deviation and a rule for what happens if the price keeps moving away. Bollinger Bands, RSI and volume can describe a setup, but agreement is not proof that it will reverse. Risk depends on sizing and execution as well as the planned stop.
Implementation Steps
- Configure: choose the mean, 20/2 band baseline, RSI settings and comparable-volume window. Treat these as test inputs.
- Specify: define entry timing, cancellation, frozen or updated targets, partial exits, maximum holding and invalidation.
- Test: use Quant to help implement the rules, inspect Code, run the backtest and reconcile individual trades.
- Size: calculate quantity from actual entry distance and the planned budget; cap correlated exposure and account for gaps.
- Review: record settings, signal time, fills and outcomes, including failures and periods with no eligible trade.
Use the Mean Reversion Playbook for additional exit examples, then test the model on the instruments and sessions it is intended to trade.
FAQs
How can Bollinger Bands and RSI identify a mean-reversion candidate?
A band extreme and classic RSI below 30 or above 70 can define a research condition. They do not confirm a reversal. Specify completed-bar timing, the entry trigger and invalidation, then compare results with and without each filter.
Do two-standard-deviation Bollinger Bands contain 95% of prices?
That is not a valid general assumption for market prices. Rolling samples and non-normal behavior do not justify interpreting a band break as a fixed-probability event. Band tags can occur during sustained trends.
How should volume be compared?
Use a specified, comparable benchmark, such as completed daily volume against the prior 20 completed daily bars. Intraday tests need comparable bars or a defined time-of-day baseline, not information from the rest of a future session.
Is risking 1–2% per trade always safe?
No. Appropriate risk depends on the account, instrument, leverage, liquidity and correlated positions. Stops do not guarantee execution prices. Calculate size from the actual entry-to-stop distance and include costs and gap scenarios.
How does Quant help test a mean-reversion strategy?
Quant can help implement explicit entry, exit and sizing rules. Inspect Code and click Run, review individual trades and evaluate costs and chronological out-of-sample results.
References
LuxAlgo Resources
- Quant Charts
- LuxAlgo Quant
- Bollinger Bands Breakout Oscillator
- Making Strategies with Quant
- Native Backtest Guide
- LuxAlgo Library
- Ultimate RSI
- Mean Reversion Playbook
- Band Indicators and Volatility
External Resources
Read next