
Most traders misuse indicators — learn five common mistakes and how to fix them with price action, timeframes, and backtesting.
When traders misuse technical indicators, they often face costly errors like delayed entries, false signals, or decision paralysis. Indicators simplify market data, but they’re tools for analysis—not guarantees. Here are five of the biggest mistakes traders make and how to fix them:
- Ignoring Price Action: Indicators reflect price rather than predict it. Combine price action, such as support and resistance, with indicators for better decisions.
- Using Too Many Indicators: Overloading charts with redundant indicators creates confusion. Stick to complementary indicators, such as one for trend, one for momentum, and one for volatility.
- Overlooking Market Context: Signals on lower timeframes mean little without aligning them with higher timeframes and the broader trend. Always check the bigger picture.
- Misunderstanding Indicators: Using indicators without knowing how they work leads to poor settings and weak trades. Learn their calculations and tailor them to your strategy.
- Skipping Confirmation Signals: Acting on one indicator increases risk. Use multiple confirmations and backtest strategies to reduce false signals.
Mistake 1: Relying Only on Indicators and Ignoring Price Action
Why Ignoring Price Action Creates Problems
Many traders place too much trust in indicators, expecting them to predict market moves. But here’s the catch: indicators are derived from price movements. As the Gotrade Team puts it, “Indicators are derived from price. Ignoring price structure weakens analysis” [4]. If you're focusing solely on tools like RSI or MACD, you're essentially analyzing a reflection of the market while ignoring the actual market itself.
Lagging indicators, such as moving averages, can be especially tricky when used on their own. By the time a moving average crossover signals a trend, the price may have already made its significant move. This often results in late entries—buying near resistance or selling near support. The Affordable Indicators team cautions that relying only on signals without context can produce poor decisions and unnecessary losses [2]. To avoid these issues, traders need to integrate price action into their analysis.
Solution: Combine Price Action with Indicators
The solution is simple: use indicators as tools to validate what price action is already telling you, rather than relying on them as the sole basis for decisions. Start by analyzing market structure—look at key support and resistance levels, trend lines, and breakout or reversal patterns. Then, use indicators to confirm these observations.
For example, LuxAlgo provides the Price Action Concepts (PAC) toolkit, which helps traders identify dynamic support, resistance, market structure, and trend-based context directly on TradingView. Its Market Structure module highlights important structural changes, such as a Change of Character, giving traders a clearer starting point. If RSI shows an oversold signal while price is bouncing from a PAC-identified support level, that alignment between price action and the indicator can strengthen the setup and improve timing. On the other hand, if price keeps making lower lows while an indicator shows bullish divergence, the divergence may be premature rather than actionable. Always make sure the indicator aligns with the broader price structure before taking a trade.
sbb-itb-cf0ed88
Mistake 2: Using Too Many Indicators That Show the Same Thing
Redundant vs Complementary Trading Indicators Comparison Chart
Problems Caused by Too Many Indicators
Loading your charts with multiple indicators that essentially measure the same thing can lead to a false sense of confirmation. This phenomenon, known as multicollinearity, happens when overlapping variables make it harder to evaluate market conditions accurately. In simple terms, you’re not gaining three separate insights—you’re just repeating the same data in different formats.
This redundancy can cause two major problems. First, it leads to decision paralysis. When your chart is cluttered with overlapping signals, it becomes harder to make clear decisions, especially during volatile market conditions [5]. Second, relying on multiple lagging indicators to align often results in entering trades too late—right when the trend is already extended or near reversal. This can severely damage your risk-to-reward ratio [5]. The key takeaway is simple: overloading your charts with similar tools does not add clarity; it usually adds noise.
Solution: Choose Indicators That Work Together
To avoid this pitfall, focus on combining indicators that complement each other rather than overlap. Think of it like assembling a team where each member brings a unique skill to the table. A practical guideline is to choose one indicator from each of three broad categories: Trend (for example, EMA), Momentum (for example, RSI), and Volatility (for example, ATR). This gives you a broader read on the market without unnecessary clutter.
For example, LuxAlgo’s Signals & Overlays (S&O) toolkit brings together several trend-focused components within one TradingView workflow, including features like Trend Tracer, Smart Trail, and Neo Cloud [6]. Instead of stacking multiple trend lines and cloud-style overlays, Neo Cloud can help summarize trend direction and dynamic support or resistance in one place. Likewise, the Oscillator Matrix (OSC) toolkit combines momentum, volatility-aware analysis, and divergence detection, which can reduce the temptation to add several overlapping oscillators to the same chart. These kinds of combinations give traders distinct insights without overwhelming their screen.
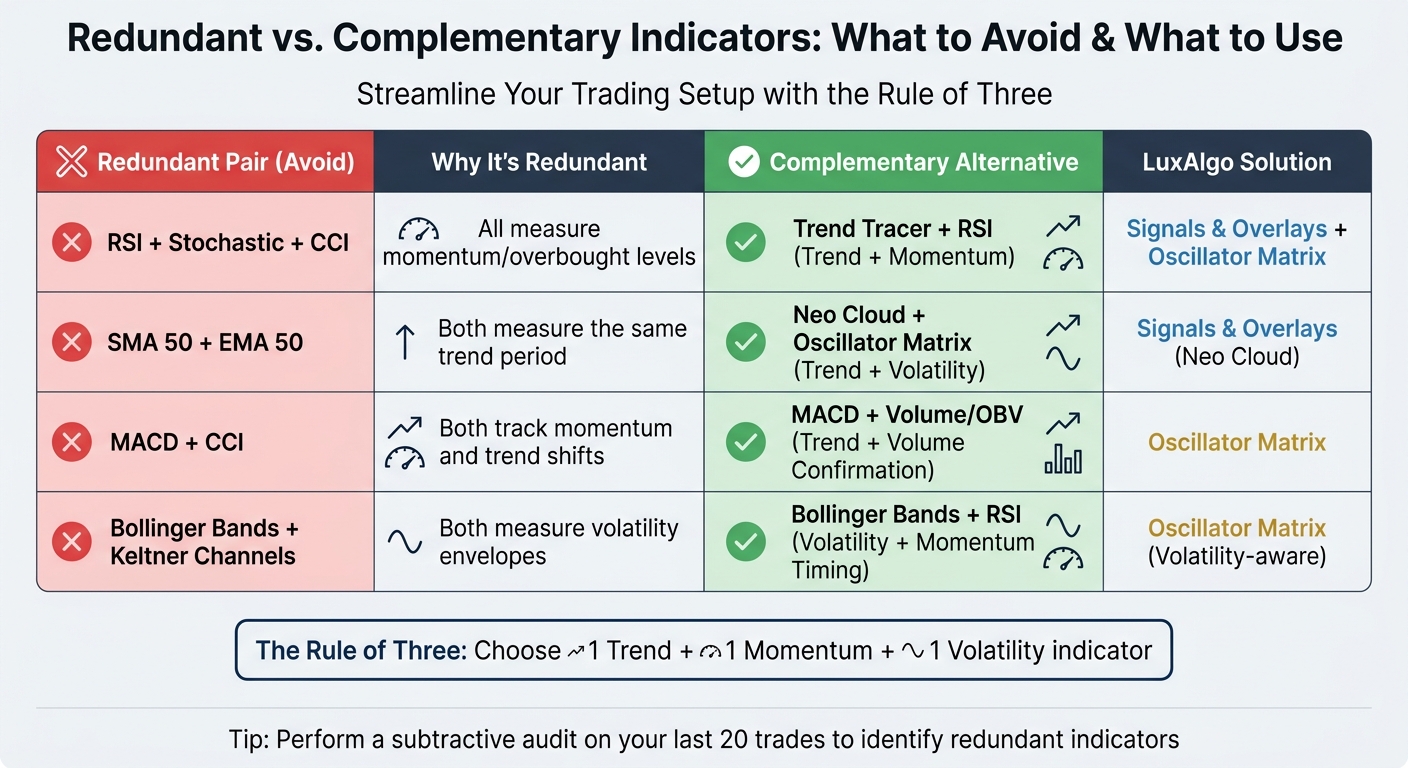
Redundant vs. Complementary Indicators
Here’s a quick comparison to illustrate the difference between redundant and complementary indicator setups:
| Redundant Pair (Avoid) | Why It's Redundant | Complementary Alternative | LuxAlgo Solution |
|---|---|---|---|
| RSI + Stochastic + CCI | All measure momentum or overbought/oversold pressure | Trend Tracer + RSI (Trend + Momentum) | Signals & Overlays + Oscillator Matrix |
| SMA 50 + EMA 50 | Both measure the same trend period | Neo Cloud + Oscillator Matrix (Trend + Momentum/Volatility) | Signals & Overlays (Neo Cloud) |
| MACD + CCI | Both track momentum and trend shifts | MACD + Volume/OBV (Trend + Volume Confirmation) | Oscillator Matrix |
| Bollinger Bands + Keltner Channels | Both measure volatility envelopes | Bollinger Bands + RSI (Volatility + Momentum Timing) | Oscillator Matrix (Volatility-aware) |
To refine your setup, perform a subtractive audit on your last 20 trades. Look at which indicators actually influenced your entries. If removing one indicator would not have changed your decision, it may not be adding value. The goal is not to collect more data, but to focus on better and more actionable information. By streamlining your chart, you make it easier to interpret market context and act with more confidence.
Mistake 3: Ignoring Market Context and Timeframes
Why Market Context Is Important
Once you've fine-tuned your indicators and paired them with price action, the next crucial step is to place those signals in the right market context. Indicators don’t operate in isolation—they need to be understood within the bigger picture. For instance, a bullish RSI signal on a 5-minute chart carries less weight if the daily chart shows a strong downtrend. Focusing only on short-term charts without considering higher timeframes such as daily, weekly, or monthly can put you at odds with the dominant market trend.
Another common pitfall is failing to determine whether the market is trending or ranging. This can lead to misread signals. For example, an RSI reading of 70 might suggest overbought conditions in a range-bound market, but in a strong uptrend it may simply reflect persistent strength. Without assessing the strength of the dominant trend and the current market environment, traders are more likely to exit winners too early or enter positions that quickly reverse. Low trading volume adds another layer of complexity because price moves without broad participation tend to make indicator signals less reliable.
Solution: Use Screeners and AI Backtesting
To align your signals with market structure more effectively, use a structured multi-timeframe process. A practical starting point is to analyze two or three timeframes: begin with a higher timeframe to define the broader trend, use a medium timeframe for confirmation, and rely on a lower timeframe for execution. If you see conflicting signals—such as a daily uptrend paired with a short-term pullback on the 1-hour chart—prioritize the higher timeframe and wait for better alignment.
Tools like LuxAlgo’s Price Action Concepts Screener can help by scanning multiple markets and surfacing confluence across symbols and timeframes. Traders can also use volume-based confirmation, such as On-Balance Volume (OBV), to check whether price movement is supported by meaningful participation instead of weak momentum.
Before risking capital, it also helps to validate your idea with LuxAlgo’s AI Backtesting Assistant and its supporting documentation here. The platform is designed to help traders scan and evaluate large numbers of strategy variations across different market conditions and timeframes, which makes it easier to spot whether an approach works better in trending or range-bound environments. Combining multi-timeframe analysis with validated testing can reduce the chances of forcing a strategy into the wrong market regime.
Mistake 4: Not Understanding How Indicators Work
Risks of Using Indicators Without Understanding Them
One common misstep traders make is using technical indicators without fully grasping how they work. It’s tempting to add tools like RSI or MACD to your charts and treat their signals—such as an RSI of 30 or a MACD crossover—as automatic buy or sell triggers. However, without understanding the math and logic behind these indicators, you risk misreading market conditions and making weak trading decisions.
For instance, the standard RSI uses a 14-period setting, but that default may not suit every trading style. Day traders might prefer shorter periods, while swing or position traders may find longer settings more useful. Similarly, applying a 50-day simple moving average to a 5-minute chart will often produce a mismatch between the calculation and the market behavior you’re trying to trade. The key is to align indicator settings with your specific timeframe, market, and strategy objective.
“Jumping into trades based on an indicator you just discovered can lead to confusion and mistakes. Every indicator has its own strengths, weaknesses, and proper context for use.” – Affordable Indicators [2]
It’s also important to recognize the limitations of different indicator types. Leading indicators such as RSI and Stochastic can produce false signals during strong trends, while lagging indicators like moving averages may produce delayed entries and exits. If you use these tools without adapting them to your strategy, it becomes much harder to distinguish valid setups from noise [4].
Solution: Customize Indicators with Quant
To avoid falling into this trap, take the time to study how indicators are calculated. For example, understanding RSI means knowing that it compares average gains and losses over a chosen lookback period, while MACD measures the distance between two exponential moving averages. Even a basic understanding of those mechanics can make your indicator choices far more intentional.
If diving into the math or coding feels overwhelming, LuxAlgo Quant is especially relevant here. Quant is an AI coding agent specialized in Pine Script for TradingView, and it can help traders generate, refine, validate, and debug indicator or strategy logic without starting from a blank editor. For traders who want to convert a chart idea into code, customize an existing workflow, or prototype a TradingView strategy faster, the Quant documentation shows how the platform is built for Pine Script generation and validation rather than generic chat. Once your logic is defined, pairing that workflow with backtesting creates a more disciplined process for matching indicator settings to real market behavior.
Mistake 5: Skipping Confirmation Signals and Risk Management
Why Confirmation Signals Matter
Relying on a single indicator can lead to costly mistakes. No indicator is flawless, and acting on just one increases the chances of falling for false signals or misreading the market [2]. For instance, a stochastic oscillator might show an overbought signal during a strong uptrend. If you short the market based on that alone, you may be fighting momentum rather than identifying a reversal.
Focusing on just one type of indicator, such as momentum, makes things worse. A well-rounded analysis needs a mix of trend, momentum, volatility, and volume inputs [2]. For example, pairing MACD with RSI can improve clarity because one tracks trend momentum while the other helps gauge relative strength. Waiting for a MACD crossover while RSI shifts out of oversold territory can help filter some lower-quality entries.
Equally important is position sizing and risk management through disciplined position sizing. Always wait for the candle to close before acting, since intrabar signals can disappear before the period finishes [8]. Traders using LuxAlgo’s ML-based signal settings can also prioritize stronger signal conditions instead of reacting to every setup. The broader lesson is that confirmation and risk control should work together: signal quality matters, but so does how much you risk when the setup fails.
Solution: Validate Strategies Through Backtesting
Strengthen your trading process by testing your indicator combinations against historical data. That means accounting for trading frictions such as commissions, spread, and slippage rather than evaluating a strategy on idealized results. For example, commissions from your broker and exchange or regulatory fees can materially change whether a strategy remains viable after costs.
LuxAlgo’s AI Backtesting Assistant can help traders evaluate strategies across different symbols and timeframes before they go live. If you are building or refining the logic yourself, Quant can also speed up the process by helping translate entry, exit, filter, and risk ideas into Pine Script strategies that are easier to test and iterate on. That combination is useful for traders exploring AI-assisted financial analysis, TradingView automation, or faster strategy prototyping.
For better accuracy, align signals across multiple timeframes. Swing traders might use the daily chart to define trend, the 4-hour chart for confirmation, and the 1-hour chart for timing. Day traders may instead rely on the 1-hour chart for directional bias, then use the 15-minute and 5-minute charts for execution. By combining multi-indicator confirmation with disciplined risk management, you build a process that is more resilient to false signals and changing market conditions.
Conclusion: Using Indicators the Right Way
Technical indicators can be incredibly useful, but their effectiveness depends on how you use them. Avoiding common mistakes in technical analysis can give traders a meaningful edge. In many cases, the difference between poor and strong results is not the indicator itself, but the way it is applied within a broader decision-making process.
The five mistakes highlighted here—ignoring price action, relying on redundant indicators, overlooking market context, misunderstanding indicators, and skipping confirmation—share a common flaw: placing too much emphasis on isolated signals instead of building a complete trading framework. Strong trading decisions come from combining price action, context, confirmation, and testing rather than chasing a single reading on a chart.
To help traders avoid these pitfalls, LuxAlgo provides resources across analysis, validation, and strategy development. Its TradingView toolkits help interpret price action, trend, momentum, and structure; the AI Backtesting Assistant helps evaluate strategy ideas across different environments; and Quant helps traders turn trading concepts into Pine Script indicators or strategies faster when they want to move from idea to implementation. Used together, these can support a more disciplined workflow without replacing sound judgment.
As a final reminder, try to use indicators from different categories—such as trend, momentum, volatility, and volume—confirm setups across multiple timeframes, and follow a consistent risk framework. Many traders use a fixed percentage model so one losing trade does not create outsized damage; for example, risking no more than 1% to 2% of account equity per trade is a common guideline, though the right number depends on your strategy and tolerance for drawdown. For more on this, see managing trade risk.
FAQs
How do I know if my indicators are redundant?
Indicators become redundant when you use multiple tools from the same category—such as MACD, RSI, and Stochastic—to tell you essentially the same thing. That overlap can create the illusion of confirmation while only repeating one type of information. A practical test is to review your recent trades and ask whether removing one indicator would have changed the decision. If the answer is no, it may be redundant.
Which timeframes should I combine for confirmation?
To confirm trades effectively, it helps to combine higher, medium, and lower timeframes. Start with a higher timeframe, such as the daily or 4-hour chart, to identify the broader trend. Then use a medium timeframe, such as the 1-hour chart, to confirm the setup. Finally, use a lower timeframe, such as the 15-minute or 5-minute chart, to refine entries and manage risk.
Matching those timeframes to your style can help filter false signals and improve timing without losing sight of the bigger picture.
How can I backtest indicators with real trading costs?
When backtesting indicators with real trading costs, include commissions, spreads, and slippage in your assumptions. That means adjusting entries and exits for spread, using realistic slippage estimates for the assets and timeframes you trade, and subtracting commissions from simulated results. These changes make your backtests much closer to actual trading conditions and produce more trustworthy performance estimates.
References
LuxAlgo Resources
- LuxAlgo
- Price Action Concepts Introduction
- Support and Resistance Trading
- Signals & Overlays Indicator Overlay
- Oscillator Matrix Introduction
- Price Action Concepts Screener Introduction
- AI Backtesting Assistant
- AI Backtesting Assistant Documentation
- Understanding RSI
- LuxAlgo Quant
- Quant Documentation
- Signals & Overlays Signals
- Signals & Overlays Settings
- The Best Indicator Settings & Timeframes
- Stress Testing for Trading Strategies
- Managing Trade Risk and Surviving Consecutive Losses