Balancing leading indicators' early signals with lagging indicators' confirmations creates stronger, more reliable trading entries.
Want better trading decisions? Understanding the difference between leading and lagging indicators is key. Leading indicators can help anticipate potential price moves, helping you spot opportunities earlier. Lagging indicators confirm trends after they begin, helping ensure you’re trading in the direction of established momentum. Both have strengths and weaknesses, but combining them can improve your strategy.
Key Takeaways:
- Leading Indicators: Aim to anticipate future price movements (e.g., RSI, Stochastic Oscillator). They can be useful for short-term trades but are more prone to false signals.
- Lagging Indicators: Confirm existing trends (e.g., Moving Averages, MACD). They are typically more reliable for trend confirmation but slower to react.
Quick Comparison:
| Feature | Leading Indicators | Lagging Indicators |
|---|---|---|
| Timing | Predictive or anticipatory (early signals) | Confirmatory (after trend starts) |
| Best For | Sideways or range-bound markets | Trending markets |
| Examples | RSI, Stochastic, Williams %R | Moving Averages, MACD, ADX |
| Drawback | False signals in strong trends | Delayed signals, missing early moves |
Pro Tip: Use both types together. For instance, spot potential reversals with RSI (leading) and confirm trend direction with a moving average crossover (lagging). This dual approach balances early detection with trend confirmation, which can help reduce avoidable mistakes.
Keep reading to learn how to combine these tools effectively for smarter trading.
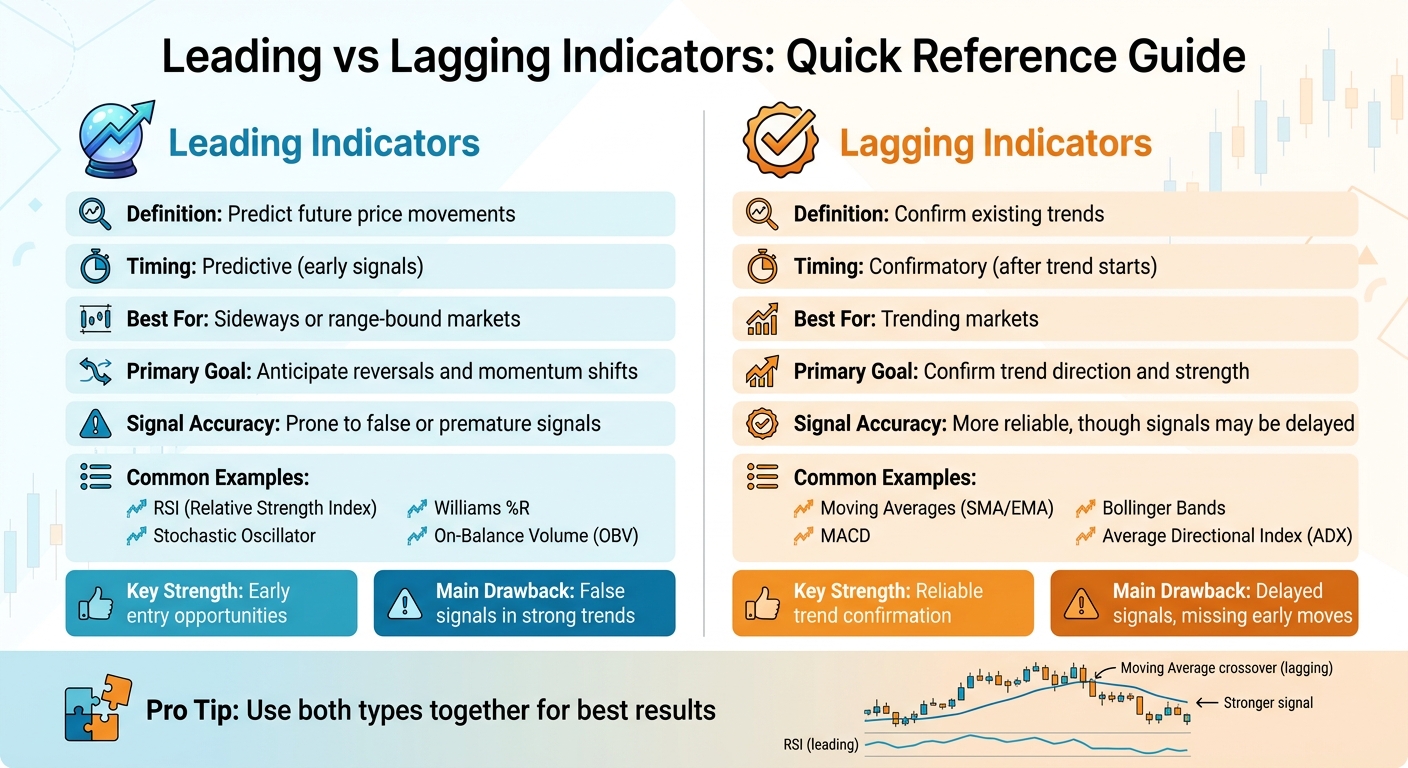
Leading vs Lagging Indicators Comparison Chart for Traders
What Are Leading Indicators?
Definition and Main Features
Leading indicators are tools that attempt to forecast future price movements by analyzing momentum, market sentiment, or changes in trading conditions before price fully reacts. They are commonly used by traders looking for earlier entries and exits, especially in shorter-term setups.
"Leading indicators point toward future events." - Investopedia
These indicators are typically more sensitive to recent price action, which makes them useful for spotting potential turning points, momentum shifts, or exhaustion before a move is fully confirmed. Many leading indicators are oscillators that move within a bounded range, often from 0 to 100, making them easy to interpret in terms of overbought and oversold conditions.
Leading indicators often perform best in sideways or range-bound markets, where price tends to rotate between support and resistance instead of trending strongly in one direction. In powerful trends, however, they can stay overbought or oversold for extended periods, which is why they work best when combined with broader trend confirmation.
Common Leading Indicators
Here’s a closer look at some widely used leading indicators:
- Relative Strength Index (RSI): This momentum oscillator measures the speed and magnitude of recent price changes. RSI values above 70 often indicate overbought conditions, while values below 30 may suggest oversold conditions. Traders also watch for divergence, where price makes a new high or low but RSI fails to do the same, as this can hint at weakening momentum.
- Stochastic Oscillator: This compares the latest closing price to its recent trading range over a chosen lookback period, often 14 periods. Readings above 80 are commonly treated as overbought, while readings below 20 are considered oversold. Traders often monitor %K and %D crossovers for potential shifts in momentum.
- Williams %R: Similar to the Stochastic Oscillator, Williams %R measures where the close sits relative to the recent high-low range. Readings near -20 can signal overbought conditions, while readings near -80 can suggest oversold conditions.
- On-Balance Volume (OBV): OBV tracks cumulative volume flow and can help traders spot accumulation or distribution. If OBV rises while price stays relatively flat, it may suggest buying pressure is building before price moves higher.
Each of these indicators has its own strengths and limitations, which is why context matters more than any single reading on its own.
Pros and Cons of Leading Indicators
Leading indicators offer traders the advantage of earlier signals, which can make them valuable for anticipating reversals or catching the start of a move before it becomes obvious to the broader market.
However, that same responsiveness also makes them more vulnerable to false signals and whipsaws. A market may appear ready to reverse, only to continue trending in the same direction.
"Leading indicators react to prices quickly, which can be great for short-term traders, but makes them prone to giving out false signals." - IG
In strongly trending markets, leading indicators can remain overbought or oversold for longer than many traders expect. Because of that, experienced traders often combine them with market structure, volume, or confirmation from trend-following indicators rather than relying on them in isolation.
One practical approach is to pair a momentum signal with confirmation from LuxAlgo’s Library or a broader price-action framework. When the topic shifts to building or refining these workflows on TradingView, LuxAlgo Quant can also help traders generate, validate, and debug Pine Script® logic for indicator combinations faster.
sbb-itb-cf0ed88
What Are Lagging Indicators?
Definition and Main Features
Lagging indicators rely on historical price data to confirm trends that are already underway. By smoothing out short-term fluctuations, these indicators help traders align with established momentum instead of trying to predict every turn in advance.
"Lagging indicators confirm long-term trends, but they do not predict them." - Investopedia
These indicators are especially helpful in trending markets, where they can filter out noise and reduce the likelihood of acting on weak signals. Their downside is that they react after a move has already started, so traders may sacrifice some early entry in exchange for higher confirmation quality.
Below are some of the most widely used lagging indicators and how they function in practical trading scenarios.
Common Lagging Indicators
-
Moving Averages (SMA/EMA):
Moving averages smooth price data over a selected timeframe. Traders often watch for crossovers, such as the 50-period moving average crossing above the 200-period moving average, to confirm bullish momentum. Exponential moving averages react faster than simple moving averages, which is why short-term traders often prefer them. -
MACD (Moving Average Convergence Divergence):
MACD is built from moving averages and is often used to confirm trend direction and momentum shifts. A crossover of the MACD line above or below the signal line can help confirm a potential change in direction. -
Bollinger Bands:
Bollinger Bands are often used as a volatility framework rather than a pure lagging signal. They consist of a moving-average basis with upper and lower bands set by standard deviation. Traders use them to assess volatility contraction, expansion, and price location relative to the recent range. -
Average Directional Index (ADX):
The ADX measures trend strength rather than direction. Readings above 25 often suggest a stronger trend, while values below 20 typically indicate weak or non-trending conditions.
Pros and Cons of Lagging Indicators
Lagging indicators come with both strengths and limitations, making it important to understand how to apply them in the right market environment.
One of their biggest advantages is that they confirm trends, reducing the risk of acting on random market noise. Because they are based on already-formed price action, they tend to produce fewer premature signals than leading indicators.
"Lagging indicators are regarded by some as safer and more reliable." - Capital.com
However, that extra confirmation comes at a cost. Signals often arrive after part of the move has already happened, which can reduce reward-to-risk if entries become late. For that reason, many traders use lagging indicators to confirm a setup identified first by a leading indicator, instead of using them as a standalone trigger.
Leading vs. Lagging Indicators: Main Differences
Side-by-Side Comparison
The main difference between leading and lagging indicators lies in their timing and purpose. Leading indicators try to anticipate future price moves, while lagging indicators confirm trends that are already underway.
"Leading indicators point toward future events. Lagging indicators confirm economic or market shifts that are already in motion." - Investopedia
Here’s a quick comparison of their key features:
| Feature | Leading Indicators | Lagging Indicators |
|---|---|---|
| Timing | Predictive; signals can appear before price fully moves | Confirmatory; signals usually appear after price has started moving |
| Primary Goal | Anticipate reversals and momentum shifts | Confirm trend direction and strength |
| Signal Accuracy | More prone to false or premature signals | Often more reliable, though delayed |
| Market Context | Best for range-bound or sideways markets | Best for trending markets |
| Common Examples | RSI, Stochastic, Williams %R, OBV | Moving Averages, MACD, ADX |
The trade-off is straightforward: leading indicators provide earlier warnings but are more vulnerable to false alarms, while lagging indicators are slower but usually better for confirmation. For example, RSI may indicate an oversold condition and hint at a possible reversal, but it does not guarantee one. A moving average crossover, by contrast, confirms that a trend has already begun.
How to Choose the Right Indicator for Your Strategy
The choice of indicators depends on your trading style, risk tolerance, and the market environment. Short-term traders often prefer leading indicators like RSI or the Stochastic Oscillator to catch earlier setups, while trend-following traders tend to rely more on lagging indicators such as moving averages or Adaptive MACD for confirmation.
Market conditions matter just as much as indicator selection. In choppy or sideways markets, leading indicators can do a better job of identifying overbought or oversold conditions. During strong directional moves, lagging indicators help filter out noise and confirm whether momentum is strong enough to justify staying with the trend. For example, an ADX reading above 25 often suggests a strong trend, while a reading below 20 points to a weaker or range-bound market.
Many experienced traders use both. They may use a leading indicator to identify a possible setup, then wait for a lagging indicator to confirm it. That layered approach can reduce false entries while still helping traders capture larger market moves.
Using Leading and Lagging Indicators Together
Why Combining Indicators Works
Pairing leading and lagging indicators helps traders reduce false signals while still taking advantage of early entry opportunities. For example, a leading indicator like the Relative Strength Index (RSI) might suggest an oversold condition, but without confirmation from a lagging indicator such as a moving average crossover, that signal could be premature.
Each indicator type helps offset the other’s weakness. Leading indicators offer earlier alerts, while lagging indicators confirm whether the broader trend supports the move. For example, if RSI rises above 30 from an oversold reading and the MACD line crosses above its signal line around the same time, the combined signal is often more meaningful than either one on its own.
| Strategy Combination | Leading Condition | Lagging Condition | Action |
|---|---|---|---|
| MACD + RSI | RSI moves above 30 (from oversold) | MACD line crosses above signal line | Buy/Long |
| RSI + Bollinger Bands | RSI moves below 70 (from overbought) | Price rejects the upper band | Sell/Short |
| MA + Volume | Volume expansion or OBV trending up | Price closes above a key EMA | Confirm Trend |
For traders who want to turn a setup like this into a TradingView workflow, LuxAlgo Quant is especially relevant. It can help generate Pine Script® indicators and strategies from natural-language rules, validate logic, and shorten the path from idea to deployment.
How to Apply This with LuxAlgo Toolkits
LuxAlgo’s TradingView toolkits make it easier to apply combined-indicator logic in practice. The Oscillator Matrix can help identify potential reversals and shifts in momentum, while Signals & Overlays adds trend-following context through tools such as the Trend Tracer and Smart Trail, which can act as adaptive support and resistance. Used together, they create a more structured workflow for pairing early signals with confirmation.
For example, a trader might wait for an Oscillator Matrix reversal signal to align with price reclaiming the Trend Tracer or holding above Smart Trail. That combination blends early momentum detection with broader trend validation. Traders can also use volume-based signals inside the Oscillator Matrix to support the move before committing capital.
Testing and Refining Strategies with LuxAlgo’s AI Tools
LuxAlgo’s AI Backtesting Assistant makes it easier to test combinations of indicators across multiple timeframes and asset classes. That is particularly useful when you want to compare how a leading-plus-lagging setup behaves in ranging conditions versus trending markets.
For more customization, LuxAlgo Quant gives traders an AI coding agent specialized in Pine Script® for TradingView®. It can help generate, validate, debug, and refine custom indicators or full strategies from plain-English prompts, which makes it useful for traders who want to convert a chart idea into code or rapidly prototype variations of an existing system. Those scripts can then be used on TradingView for chart analysis, alerts, and strategy testing.
If you want to move beyond manual indicator combinations, Quant is one of the most natural next steps because it reduces coding friction while keeping the workflow centered on TradingView strategy and indicator development. For traders exploring AI-assisted development in 2026, that makes it one of the more practical ways to go from concept to deployable script.
Conclusion
A well-rounded trading strategy uses both leading and lagging indicators to make more informed decisions. Leading indicators like RSI and Stochastic can help identify potential reversals early by tracking momentum shifts. They tend to be most useful in range-bound markets but can produce more false signals during strong trends. Lagging indicators, such as Moving Averages, MACD, and ADX, confirm trend direction and help filter out short-term noise, though they naturally react more slowly.
The strongest workflows often combine the two. Traders can use leading indicators to identify a possible opportunity, then rely on lagging indicators to confirm that the broader trend supports the trade. This creates more dependable entry logic than relying on either category alone.
LuxAlgo provides practical ways to apply that process on TradingView. The Oscillator Matrix helps detect shifts in momentum, while Signals & Overlays can validate trend strength with tools such as dynamic support and resistance levels that adapt to changing volatility. For traders who want to test ideas systematically, AI Backtesting Assistant can help evaluate whether a leading-plus-lagging setup holds up across markets and timeframes.
For traders who want more control, Quant’s documentation explains how LuxAlgo Quant can be used to create custom indicators and strategies from natural-language prompts or chart images, then validate Pine Script® logic before it reaches the chart. That makes it especially useful when you want to move from indicator theory to a working TradingView implementation without building everything manually from scratch.
FAQs
How do I know if the market is trending or range-bound?
To identify a trending market, look for sustained higher highs and higher lows in an uptrend or lower highs and lower lows in a downtrend. Lagging indicators like moving averages can help smooth price action and confirm that trend.
In contrast, a range-bound market tends to move horizontally between support and resistance. Oscillators like RSI, Stochastic, or Bollinger Bands can help highlight overbought and oversold conditions within that range.
Reading price structure alongside these indicators usually gives a clearer answer than relying on one signal alone.
What’s the simplest way to combine a leading and a lagging indicator?
One straightforward method is to use a leading indicator such as RSI or the Stochastic Oscillator to identify a possible entry, then confirm the setup with a lagging indicator like a moving average or MACD. That combination helps balance early detection with trend confirmation.
How can I reduce false signals without missing big moves?
To reduce false signals while still catching meaningful moves, combine leading and lagging indicators. Leading indicators such as RSI or other momentum tools can flag possible setups early, but you can improve confidence by confirming those signals with lagging tools like moving averages or MACD.
If you want to formalize that process into a repeatable TradingView workflow, LuxAlgo Quant can also help you turn those rules into Pine Script® for testing and refinement.
References
LuxAlgo Resources
- LuxAlgo
- LuxAlgo Library
- Adaptive MACD
- Support & Resistance Dynamic
- AI Backtesting Assistant
- LuxAlgo Quant
- Quant Documentation