
Use 2–3 complementary indicators—trend, momentum, volume—organize panes, and backtest to cut false signals and chart clutter.
When trading, using too many indicators can clutter your chart, slow decision-making, and lead to conflicting signals. Instead, focus on combining 2-3 complementary indicators that each serve a distinct purpose: trend, momentum, or volume analysis. This approach simplifies your setup while improving signal quality.
Key takeaways:
- Avoid redundancy: Indicators like RSI and Stochastics can often reflect similar momentum conditions, which may add noise without much new information.
- Organize your chart: Separate trend, momentum, and volume indicators into distinct panes for better clarity.
- Use LuxAlgo selectively: Combine Price Action Concepts for market structure, Signals & Overlays for confirmation and overlays, and Oscillator Matrix for momentum so each layer adds a different perspective.
- Test your setup: Use backtesting tools to validate your strategy, remove duplicate signals, and refine parameters for better consistency.
How Too Many Indicators Damage Your Trading
Packing your chart with indicators might feel like you're gaining an edge, but it often does the opposite - it clutters your screen and leaves you overwhelmed. When oscillators, moving averages, and trend lines pile up, you're not actually uncovering new insights. In many cases, you're just looking at the same market data from slightly different angles.
The problem often comes down to multicollinearity - multiple indicators reacting to the same underlying price behavior. For instance, combining RSI with Stochastics can produce nearly identical momentum readings. That kind of overlap can create a false sense of confirmation, as if you're double-checking your analysis. In reality, it can lead to conflicting signals and slower decisions.
When Too Much Information Leads to Indecision
Overloading your charts can paralyze your decision-making. Conflicting signals from multiple lagging indicators often result in hesitation, costing you opportunities and weakening your risk-to-reward profile. Each extra indicator adds to your mental workload, making it harder to interpret what you're seeing at the moment you need to act.
"More information is not always better information. In trading, clarity usually beats complexity."
This is where the “perfect entry” fallacy shows up. Traders may wait for several indicators to align before taking action, but by the time they do, the move may already be well underway or close to exhaustion. That can lead to wider stop losses, late entries, and trades that no longer offer an attractive reward relative to risk.
How Overlapping Indicators Create Misleading Signals
Using similar indicators together can also create a false sense of confirmation. Pairing RSI with Stochastics, for example, often results in both peaking or bottoming out around the same time. That redundancy doesn’t necessarily add insight - it can simply reinforce the same message and make the setup look stronger than it really is.
Because many indicators are derived from past price data, waiting for several of them to align often means acting on delayed information. What appears to be confirmation may actually be a sign that the move is already mature. In practice, many traders get more value from two or three well-chosen indicators than from a chart packed with overlapping tools.
Excessive indicators also create visual clutter, obscuring what really matters: price action. Key signals like bearish engulfing patterns, institutional order blocks, or major supply and demand zones can get buried under layers of oscillators and moving averages. These price-based cues are often easier to act on when the chart is clean.
"If removing an indicator doesn't materially change your decision, that indicator may be redundant."
Selecting Indicators That Work Together
Every indicator on your chart should bring something different to the table. If two indicators measure the same thing, you're not only wasting space but also increasing the odds of unnecessary clutter. The goal is to build a setup where each tool contributes to a different part of the analysis.
3 Main Types of Indicators
To keep things organized, indicators can be grouped into three main categories:
- Trend indicators: These help identify the general direction of the market by analyzing price behavior over time. They answer the question, “Where is the market heading?”
- Momentum indicators: These show whether a price move is gaining or losing strength. They can help flag overextended conditions or possible reversals.
- Volume indicators: These help confirm whether a move has broad participation and can improve the quality of breakout and trend-following signals.
LuxAlgo’s TradingView products fit naturally into these categories. For example:
- Price Action Concepts (PAC): Focuses on trend analysis and market structure, helping traders identify directional bias.
- Oscillator Matrix (OSC): Tracks momentum and can help highlight when a move is stretched.
- Signals & Overlays (S&O): Provides confirmation and overlay features using tools such as Smart Trail and Neo Cloud.
By selecting one tool from each category, you can cover different aspects of market behavior without creating unnecessary overlap.
How to Avoid Using Redundant Indicators
Once you’ve categorized your indicators, the next step is removing redundancy. Stacking multiple indicators that provide nearly identical information can make the chart look more sophisticated while actually making it harder to trade.
Instead, combine tools that complement each other. For example, pairing market structure with divergence analysis can give a fuller picture of trend continuation versus reversal risk. Likewise, using a trend filter alongside a volume confirmation tool can help you distinguish stronger breakouts from weaker ones.
As a rule, try to ensure each indicator represents a different function - trend, momentum, volume, or volatility. If one category is already covered well, resist the urge to add another tool from the same group unless it clearly improves your process. This keeps your setup streamlined and your decisions easier to execute.
Setting Up Your Chart Layout for Multiple Indicators
Keeping your chart organized is essential for effective analysis. A cluttered layout not only slows you down but also makes it harder to spot opportunities. To stay focused, arrange your indicators in a logical, visually clear manner.
Separating Indicators Into Different Panes
To avoid overcrowding, place price overlays directly on the main chart while keeping momentum and volume tools in separate panes. This helps each signal remain readable instead of competing for attention.
LuxAlgo’s Multi-Chart Widget takes this idea further by letting you display multiple charts beside your main chart for multi-timeframe analysis. That can make it easier to monitor a lower-timeframe setup while still tracking higher-timeframe structure.
For dashboard elements such as Trend Strength or Volatility metrics, you can reposition them to different corners of the chart. If they still feel intrusive, reduce their size or hide non-essential elements using the toolkit settings in the dashboard documentation.
Using Colors and Custom Settings to Reduce Clutter
Thoughtful color choices can make charts easier to read. Use high-contrast colors for buy and sell signals so they stand out immediately. For supporting indicators, muted tones often work better because they stay visible without dominating the view.
LuxAlgo’s candle coloring features can also reduce clutter. For example, gradient-based coloring in the Neo Cloud can help show the maturity of a trend directly on price bars, reducing the need for additional visual layers on the chart.
Adjusting opacity and line styles also creates a clear hierarchy. Highlight primary signals with brighter or thicker lines, while keeping supporting tools lighter. These small tweaks can make a big difference when multiple features are active at once.
The 2-3 Indicator Rule
Even a well-organized chart can become overwhelming if overloaded with tools. The most effective setups often rely on just 2-3 key indicators matched to a trader’s style and timeframe.
LuxAlgo’s presets can simplify the process by enabling a practical starting configuration with a single click. From there, the most useful step is usually subtraction: keep the features that directly improve your decisions and remove the rest.
"The ideal way to utilize this indicator is to explore through all of the features over time, pick & choose 2-3 features best suit your style of trading, and stick with those to create your own unique LuxAlgo trading strategy."
This selective approach pairs well with PAC, S&O, and OSC because each one can cover a different function without forcing your chart to do too much at once.
How to Combine LuxAlgo's PAC, S&O, and OSC Tools
Trading Indicator Performance Comparison: Single vs Combined Tools
Once you've optimized your chart layout, it's time to integrate LuxAlgo's TradingView products for a more structured workflow. PAC focuses on market structure by identifying swing highs, swing lows, breaks of structure, and changes of character. S&O adds confirmation and overlay features such as Neo Cloud, while OSC helps track momentum and divergence. Used together, they can create a cleaner decision framework because each one handles a different analytical job.
Step-by-Step Guide to Combining Tools
-
Add all three products to your TradingView chart:
- PAC: Place this on the main chart to monitor market structure. Enable BOS and CHoCH conditions if those are core to your process.
- S&O: Use this as an overlay and tune its settings to fit the asset and timeframe you're trading.
- OSC: Position this in a separate pane below the price chart so momentum and divergence remain easy to read.
- Use LuxAlgo’s backtesting workflow to connect structure and confirmation logic. In the PAC Backtester, the CONDITIONS (ADVANCED) section supports external conditions and structured multi-step entries, which makes it easier to test confluence rules without adding more visual clutter to the chart. More details are available in the PAC entry rules documentation.
-
Employ the Step & Match approach to sequence confirmations:
- Set PAC conditions such as bullish CHoCH or BOS as Step 1 to define structure.
- Assign S&O or OSC conditions as Step 2 for entry confirmation.
For example, PAC may identify a bullish structure shift, S&O may confirm trend alignment through an overlay signal, and OSC may support the idea with bullish momentum behavior. That kind of layered confirmation is usually more useful than simply stacking three indicators that all describe the same thing.
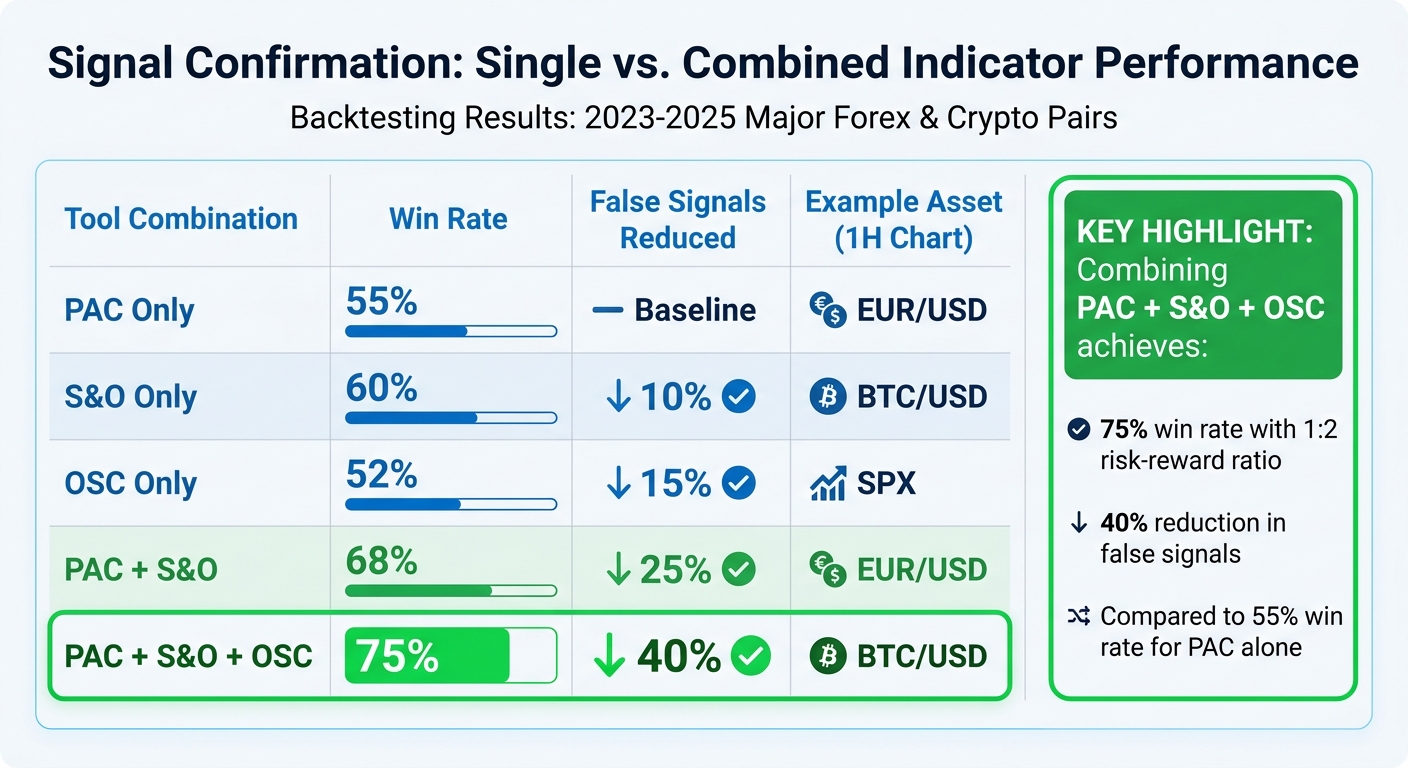
Signal Confirmation: Single vs. Combined Tools
Combining these products is often most effective when the goal is role separation, not signal multiplication. PAC can define the structural bias, S&O can help filter for trend-friendly conditions, and OSC can add momentum context. In trending environments, that can improve clarity compared with relying on a single indicator in isolation.
| Tool Combination | Primary Role | Main Benefit | Example Use Case (1H Chart) |
|---|---|---|---|
| PAC Only | Market structure | Defines directional bias | EUR/USD trend continuation |
| S&O Only | Confirmation / overlays | Filters entries with overlay context | BTC/USD trend-following |
| OSC Only | Momentum | Highlights divergence and momentum shifts | SPX reversal monitoring |
| PAC + S&O | Structure + confirmation | Aligns trade triggers with market bias | EUR/USD pullback entries |
| PAC + S&O + OSC | Structure + confirmation + momentum | Adds confluence without relying on one indicator type | BTC/USD trend and reversal filtering |
This comparison is best treated as a workflow framework rather than a universal performance ranking. The real advantage comes from reducing overlap: PAC sets direction, S&O helps confirm conditions, and OSC adds momentum context. In ranging markets, traders often get better results by becoming more selective and waiting for structure and momentum to agree.
Testing Your Indicator Combinations with LuxAlgo Backtesters
Once your chart setup is ready and your indicators are in place, the next step is validation. LuxAlgo’s Backtesters let you simulate historical behavior and review metrics such as win rate, profit factor, and drawdown before risking capital. Because the logic runs inside TradingView, you can test a strategy across many different assets and timeframes in a consistent workflow.
The backtesters also help you visually review historical entries and exits, which makes it easier to see whether each indicator is actually adding value. If adding another indicator barely changes the result or mostly repeats existing signals, that may be a sign the setup is becoming more complex without becoming more useful.
Finding and Removing Duplicate Signals
Duplicate signals happen when multiple indicators trigger at the same time or on adjacent bars while effectively saying the same thing. To spot this, backtest your rules across a meaningful sample of historical data and compare when each condition fires.
For example, if OSC momentum triggers repeatedly line up with an S&O confirmation that you already trust, you may not need both in every version of the strategy. In that case, keep the tool that best matches your process and simplify the rest.
LuxAlgo’s PAC Backtester can help with this by structuring rules into steps and matches. That makes it easier to separate “must happen first” conditions from “must confirm next” conditions and avoid treating repeated versions of the same signal as fresh opportunities.
If you're building custom TradingView logic instead of only using visual configurations, LuxAlgo Quant is especially relevant here. Quant is an AI coding agent specialized in Pine Script for TradingView, so traders can use it to prototype indicator logic, validate conditions, and debug overlapping entry rules before testing them more broadly.
Using Backtesters and AI to Refine Your Setup
For traders who want a faster optimization workflow, LuxAlgo’s AI Backtesting Assistant can speed up the process of searching for, comparing, and refining strategy ideas. Rather than manually cycling through every variation, you can use natural language to explore setups and then review the results inside a more structured research process.
Quant also fits naturally into this workflow when the idea needs to become code. If you want to convert a chart concept into a Pine Script indicator or strategy, Quant can help generate, validate, and refine that script before you move into more formal backtesting. That makes it useful for traders exploring AI-assisted financial analysis, TradingView automation, or faster strategy prototyping in 2026.
To check whether you have genuine synergy versus redundancy, run parallel tests. Start with a baseline version using one indicator, then add a second, then a third. If the added logic improves selectivity, risk control, or consistency, it may be contributing real value. If it mostly increases complexity, it may be a candidate for removal.
That same iterative process also makes it easier to avoid overfitting. Test across multiple assets and timeframes, keep your sample size meaningful, and look for setups that remain reasonably consistent rather than only performing well in one narrow market condition.
Conclusion
Crafting an effective chart means focusing on indicators that provide distinct insights, organizing the layout to avoid unnecessary clutter, and testing your setup with real data. Overloading a chart with similar tools usually creates confusion rather than conviction, so clarity should remain the priority.
LuxAlgo’s products make this process more structured. PAC can help with price structure, S&O can support confirmation and overlays, and OSC can add momentum context. Their Multi-Chart Widget can also make multi-timeframe analysis easier to manage when a single chart starts feeling crowded.
Thorough testing is what turns a clean chart into a repeatable workflow. LuxAlgo’s Backtesters and AI Backtesting Assistant can help traders evaluate combinations more efficiently, while Quant can help translate an idea into Pine Script when custom logic is needed. Together, that creates a useful path from concept to validation without forcing a chart to become visually overloaded.
"The best indicator stack is usually the one where every component has a clear job and no component is there just for comfort."
The best approach is still the simplest one: start with 2–3 indicators that serve different purposes, test them rigorously, and remove anything that doesn’t improve your process. By choosing complementary indicators, refining your layout, and validating the setup properly, you can build a strategy that is both cleaner and easier to execute.
FAQs
How do I choose my 2–3 indicators?
To pick 2–3 indicators effectively, aim for a mix that works well together and delivers clear, consistent signals without contradiction. A common starting point is combining one trend tool, one momentum tool, and one confirmation or volume tool. For example, traders often pair a moving average with RSI and MACD or a volume-based confirmation depending on the market.
Choose indicators that address different parts of analysis rather than repeating the same function. This reduces redundancy and keeps your chart easier to interpret under pressure.
What’s a simple way to spot redundant indicators?
A simple rule is this: if two indicators are frequently giving you the same signal at the same time, one of them may be redundant. For example, stacking several momentum oscillators can create overlap without meaningfully improving your decision quality. Simplifying the chart often makes the remaining signals easier to trust and act on.
How should I lay out indicators on my chart?
For clarity, overlays such as moving averages or trend clouds usually belong on the main price chart, while oscillators like RSI or MACD are better placed in separate panels. Keep the number of active tools manageable and use multiple panes or linked charts when necessary. The goal is to make every signal readable at a glance instead of forcing several visual layers into the same space.
References
LuxAlgo Resources
- LuxAlgo
- Price Action Concepts
- Supply and Demand Zones: Identifying Critical Areas for Trading Success
- Pure Price Action Structures
- Signals & Overlays Settings
- Signals & Overlays Indicator Overlay
- Multi-Chart Widget
- Multi-Timeframe Market Formation
- Signals & Overlays Dashboard
- Backtester (PAC) Entry Rules
- LuxAlgo Quant
- AI Backtesting Assistant