

Volume indicators are essential for understanding market activity, but they come with challenges like false signals, manipulation, and lack of context. These issues can lead to poor trading decisions if not addressed. Here’s a quick summary of the key problems and solutions:
Key Problems:
- Lack of Context: Volume spikes don’t explain why they occur (e.g., news, institutional trades, or algorithms).
- Manipulation: Tactics like wash trading, spoofing, and dark pools can distort what you see on standard volume metrics.
- False Signals: Indicators often lag, struggle with gaps, and misinterpret thin trading periods.
Solutions:
- Combine Methods: Use volume indicators with price action and trend analysis for better confirmation.
- Historical Context: Compare current volume to averages (e.g., 20-day) and track patterns during key events.
- Advanced Platforms: Platforms like LuxAlgo provide TradingView indicators, real-time alerts, divergence detection, and AI backtesting to help refine strategies.
By pairing volume analysis with other methods and leveraging advanced platforms, you can reduce errors and improve trading decisions.
Best 3 Volume Indicators That Help Filter Out False Trade Signals
Embedded iFrame
Common Problems with Volume Indicators
Volume indicators can provide traders with useful insights into market activity, but they also come with several challenges that can complicate decision-making. Recognizing these limitations is essential for building a more balanced trading strategy that doesn’t overly depend on volume data.
Missing Context Behind Volume Changes
Volume indicators tell you what’s happening, but they don’t explain why it’s happening. For instance, a sudden spike in volume might grab your attention, but the indicator won’t clarify whether it’s due to institutional buying, retail panic selling, an earnings announcement, or algorithmic trading activity.
This lack of context can make interpretation tricky. A volume spike that looks bullish at first glance might actually reflect large-scale selling, hedging flows, or automated portfolio rebalancing.
The situation becomes even murkier during events like earnings releases or major news announcements. In these cases, volume spikes often blend fundamental trading with speculative moves, leaving traders with incomplete information.
To add to the complexity, after-hours trading can distort volume analysis. Many volume indicators don’t cleanly separate regular-hours activity from extended sessions, which can make the next day’s opening context harder to read if you’re only looking at one combined volume series.
And it’s not just about misinterpreting volume sources - traders also have to grapple with intentional market distortions.
Market Manipulation Issues
Volume data is vulnerable to manipulation, which can lead to misleading signals. Large participants and high-frequency systems can employ tactics that distort volume-based readings or the apparent depth of supply and demand.
One common tactic is wash trading, where an entity buys and sells the same security (or effectively trades with itself) to artificially inflate trading activity. It can make an asset look more liquid or more “in demand” than it really is.
Then there’s spoofing, where traders place large orders they have no intention of executing. This creates the illusion of heightened supply or demand, influencing order-flow sensitive strategies and misleading traders who interpret the displayed orders as genuine interest. (In U.S. futures markets, spoofing is prohibited under the Commodity Exchange Act; the CFTC describes it as bidding or offering with the intent to cancel before execution.)
Another factor complicating volume analysis is the rise of dark pools - private venues where institutional investors execute large trades with less immediate transparency. This means the volume shown on standard charts may not fully reflect where trading interest actually occurred across all venues. For a clear overview aimed at investors, FINRA explains how dark pools (ATSs) work and why they exist.
Algorithmic trading adds another layer of distortion. High-frequency systems can generate large bursts of activity very quickly, creating spikes that may have little to do with durable sentiment. These surges can trigger false positives in volume-based strategies, especially when they occur around key levels and then fade.
These examples underscore the importance of using volume indicators alongside other methods to create a more complete analysis.
False Signals and Delayed Data
In volatile markets, volume indicators often generate false signals due to rapid price swings and inherent delays in their calculations.
Lagging data is a significant issue. Most volume indicators rely on completed time periods to calculate values, meaning they show past activity rather than what’s currently unfolding. In fast-moving markets, this delay can cause traders to act after the best opportunity has already passed.
Periods of thin trading can also create misleading signals. A small uptick in volume during these times might appear significant, triggering buy or sell signals that wouldn’t occur during busier trading hours.
Volume indicators also struggle with gap openings and limit moves. When a stock gaps up or down significantly at market open, the previous session’s volume context can become less relevant. Similarly, when a market hits a trading halt or limit condition, volume may drop - not because interest disappeared, but because trading is constrained.
Another challenge is the normalization problem. Different assets have vastly different typical volumes, so “high volume” should almost always be evaluated relative to that asset’s history (and ideally relative to the session/time-of-day). That’s why comparing current activity to rolling averages and event baselines matters.
To navigate these challenges, traders should pair volume indicators with other analytical methods and robust platforms for a more comprehensive approach.
Solutions and Best Practices for Volume Indicators
Volume indicators can be tricky to rely on by themselves, but traders can overcome their limitations with the right strategies. The secret? Building a more complete analytical framework that combines volume data with other tools for better accuracy and fewer false signals.
Combine Volume with Other Analysis Tools
Volume data becomes much more effective when paired with tools like price action analysis, trend indicators, and market structure insights. Instead of acting solely on volume signals, successful traders use them alongside other methods to confirm their setups.
For example, a price breakout above resistance is far more convincing when it's backed by a surge in volume and a strong bullish candlestick pattern. On the flip side, a breakout with low volume - especially if it's below the 20-day average - often signals weakness and a higher chance of reversal.
Moving averages are another great companion to volume indicators. When price breaks above a widely watched average (like a 50-day) with volume expanding above its baseline, it can improve confidence that the move isn’t just a short-lived push.
Price action patterns also add crucial context. A volume spike during a doji candlestick might indicate indecision, but the same spike during a hammer pattern at a key support level could suggest stronger dip-buying interest. This added layer of interpretation helps traders understand what the volume is really saying.
On TradingView, LuxAlgo’s Price Action Concepts (PAC) can automate many of these confirmations by mapping market structure and identifying volumetric order blocks that traders often use as potential reaction zones.
Once you've mastered combining volume with other methods, the next step is to study historical volume behavior for deeper insights.
Track Historical Volume Patterns
Looking at volume in context - rather than just raw numbers - can reveal a lot about market activity. Comparing current volume to historical averages helps traders separate routine fluctuations from meaningful moves.
A common benchmark is the 20-day average volume. If current volume exceeds this average by 50% or more during a breakout, the move is generally more credible than similar price action with below-average volume. This comparison helps traders avoid weak signals that often lead to failed trades.
Seasonal volume patterns are also worth noting, especially in sectors with predictable cycles. For instance, tech stocks often see higher trading volumes during earnings season, while retail stocks experience spikes before the holiday shopping quarters. Recognizing these patterns can help traders avoid overreacting to volume surges that are entirely expected.
Time-of-day volume analysis is another useful tool. The first and last hours of the trading session typically see heavier participation, making breakouts during these periods more meaningful than those that happen during quieter midday hours.
Historical volume tracking becomes even more critical during news events and earnings releases. Comparing current spikes to prior, similar events for the same ticker can help you judge whether the reaction is in-line with history or unusually extreme.
With these insights in hand, advanced platforms can take your volume workflow to the next level.
Use Advanced Trading Platforms
Advanced platforms can materially improve volume workflows by adding faster signal delivery, configurable alerts, and integrated context that reduces “single-indicator” decision-making.
Real-time volume alerts allow traders to act quickly on developing opportunities. With LuxAlgo’s Signals & Overlays, you can configure TradingView alerts to trigger when conditions align, rather than manually watching every candle.
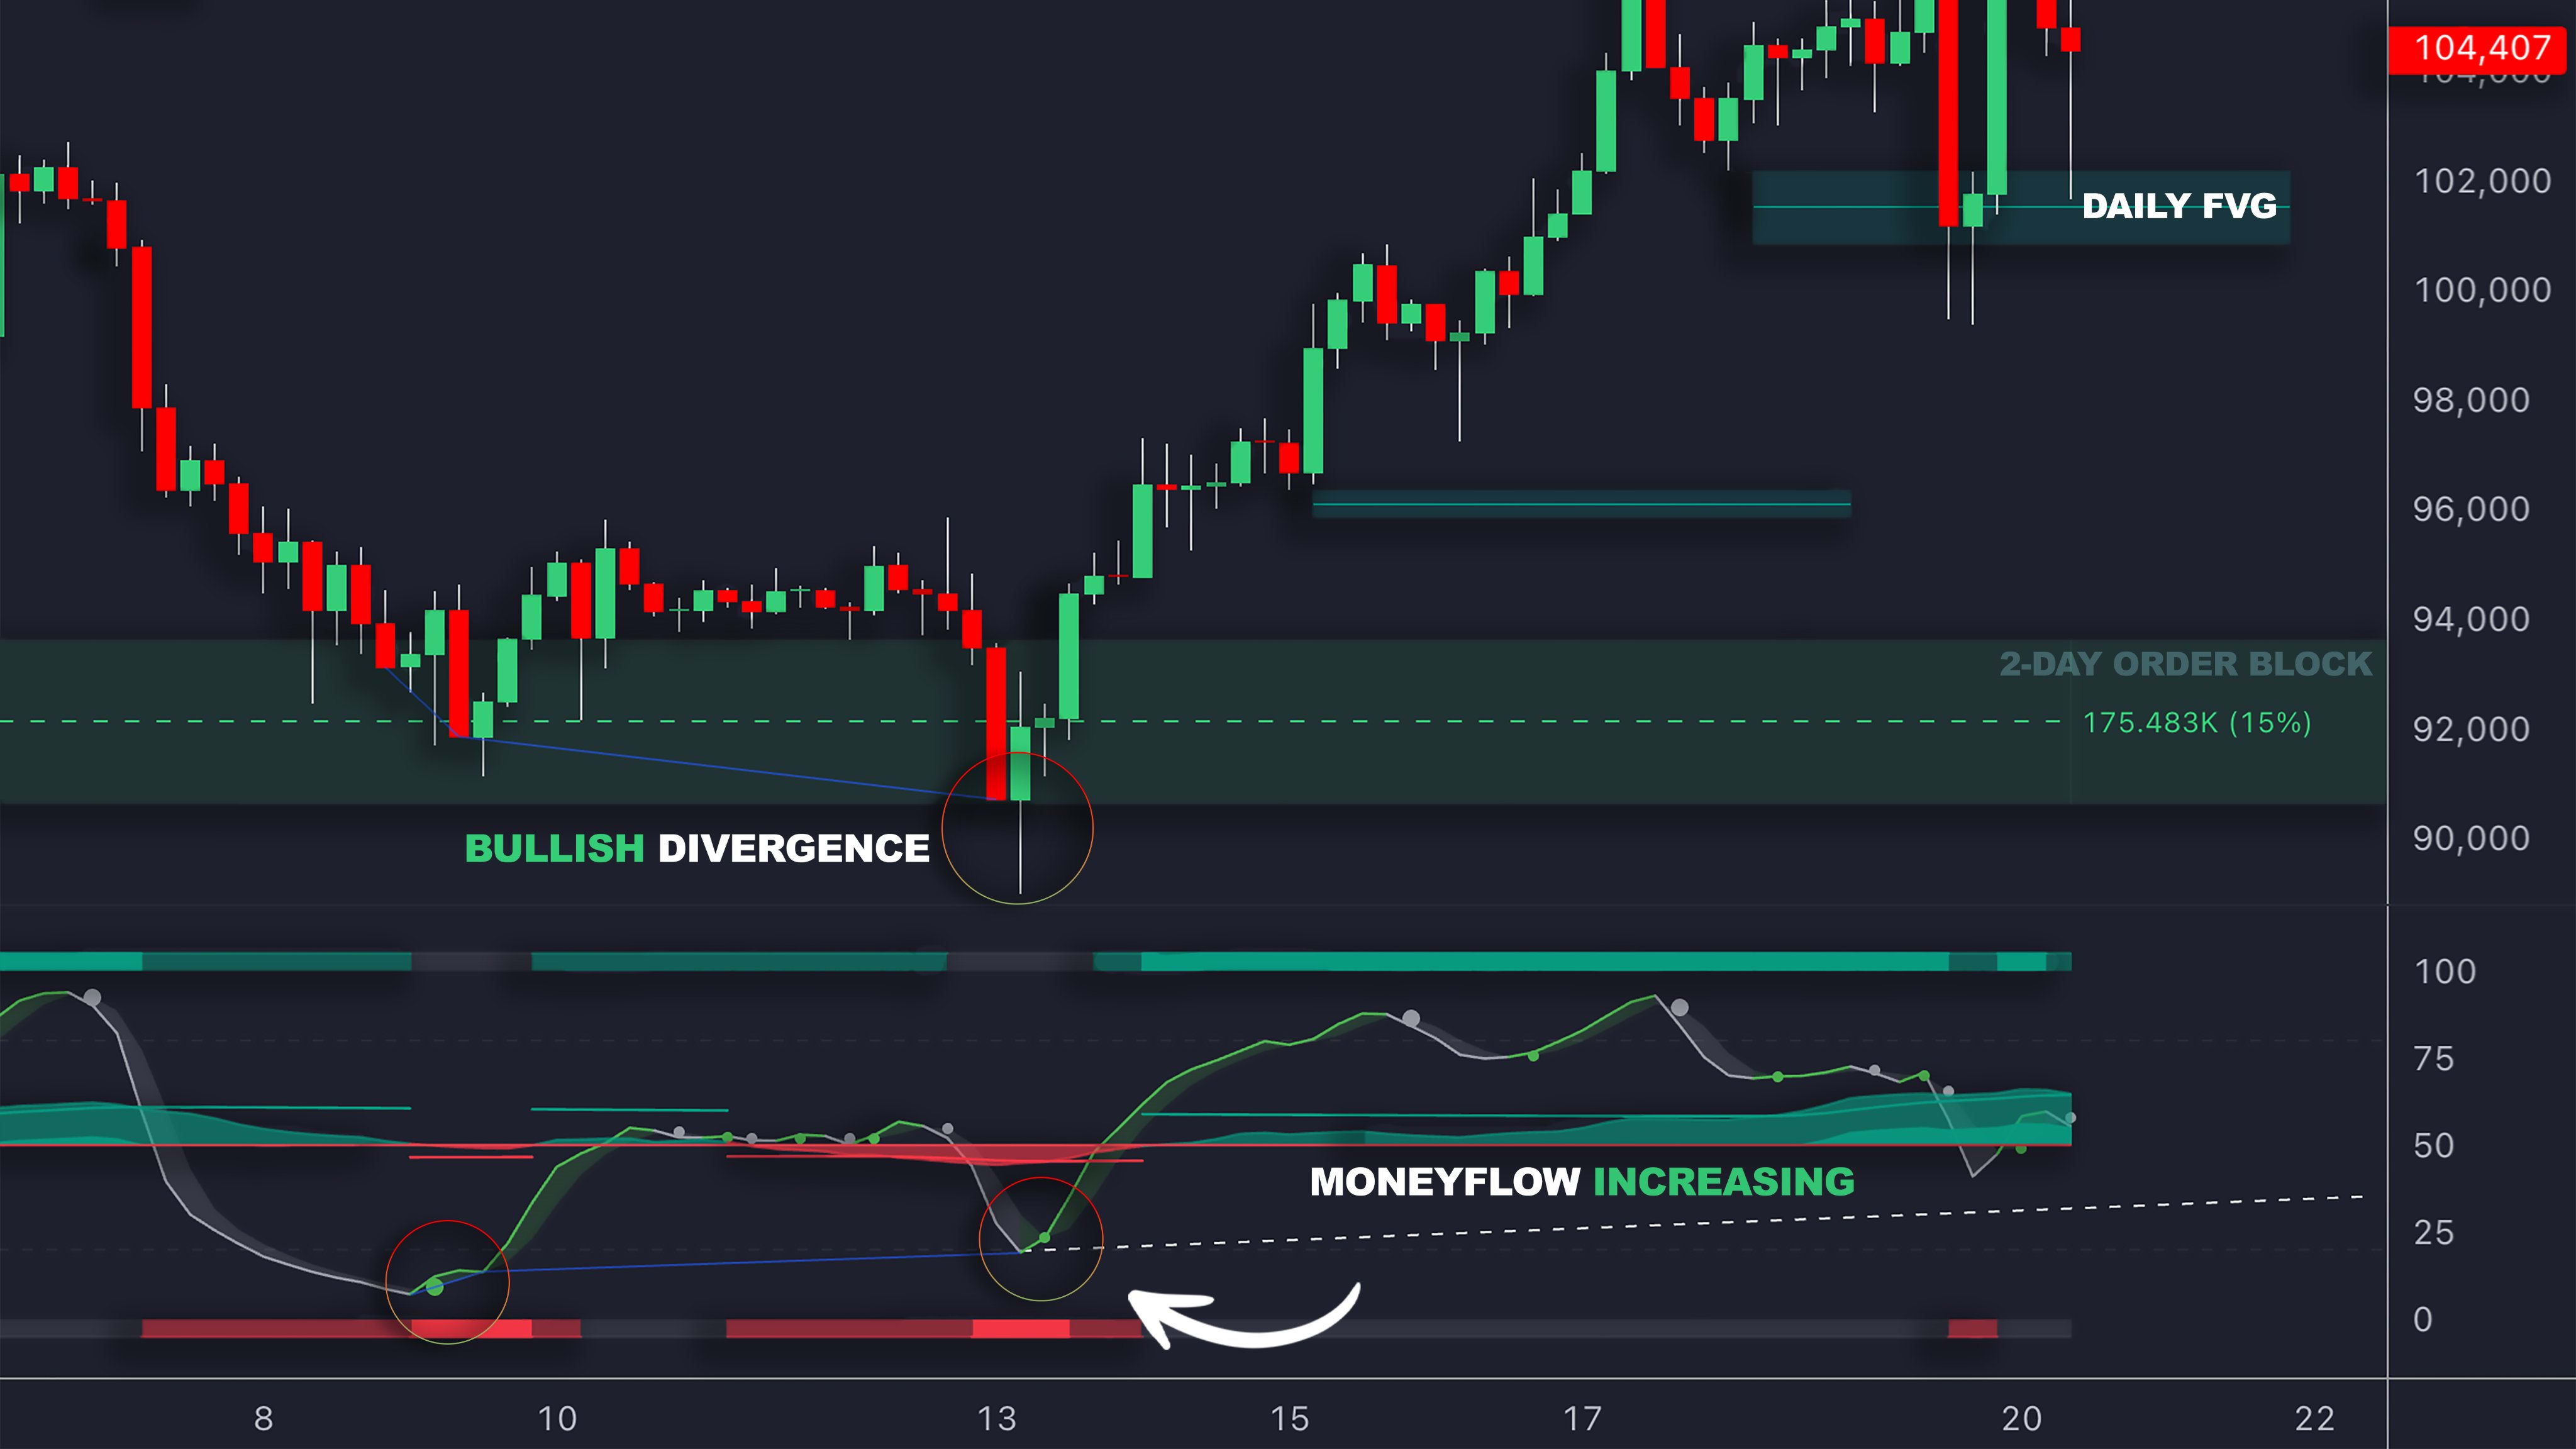
LuxAlgo’s Oscillator Matrix is designed to combine money flow with divergence-style cues, which can help reduce false positives that come from reacting to a volume spike in isolation. For example, if a spike occurs but the oscillator context shows weakening momentum, you may treat the move as exhaustion rather than continuation.
The AI Backtesting Assistant also helps traders pressure-test volume-driven ideas across multiple assets and timeframes using the web platform at luxalgo.com/backtesting. Instead of assuming a “volume rule” works broadly, you can evaluate it across different regimes and refine entry/exit logic based on what actually held up historically.
For those who prefer familiar charting environments, seamless integration with TradingView ensures you can keep one charting workflow while adding alerts and indicator context.
Finally, customizable indicators allow traders to tailor their volume analysis to fit their style and the specific market they’re trading. Whether it’s adjusting for different asset classes, volatility levels, or timeframes, this flexibility helps address the common issues that arise when applying standard volume approaches across diverse markets.
sbb-itb-cf0ed88
Volume Indicator Comparison
Volume indicators play a key role in trading analysis, offering unique insights into market behavior. By understanding the strengths and limitations of each indicator, traders can select the most effective tool for specific market conditions. These indicators process volume data in different ways, which means their performance varies depending on the trading scenario.
On-Balance Volume (OBV) is calculated by adding volume on days when prices close higher and subtracting it on days when prices close lower. This running total helps identify divergences between price and volume. OBV is particularly good at spotting early signs of trend weakness - like when prices hit new highs but the indicator fails to confirm the move. However, it tends to underperform in sideways or choppy markets. (See TradingView’s OBV reference for the standard definition and calculation.)
Volume Weighted Average Price (VWAP) determines the average price of a security, weighted by trading volume, over a single session. Many institutional participants use it as an intraday benchmark; it’s also commonly treated as a dynamic support/resistance reference on liquid products. VWAP works best for intraday context because it resets each session. If you’re new to it, TradingView’s VWAP reference is a solid starting point.
Accumulation/Distribution (A/D) combines price and volume by analyzing where the closing price falls within the day's range. For instance, if a stock closes near its high on strong volume, it suggests stronger buying pressure than if it closed mid-range. This indicator can be skewed by large gap openings.
Money Flow Index (MFI) is a volume-weighted oscillator that integrates price and volume momentum to identify overbought or oversold conditions. While it can help spot momentum shifts, its signals often require confirmation in strongly trending markets to reduce whipsaws.
Volume Indicator Comparison Table
| Indicator | Strengths | Weaknesses | Best Market Conditions | LuxAlgo Integration |
|---|---|---|---|---|
| On-Balance Volume (OBV) | Highlights price-volume divergences; Easy to use; Effective in trending markets | Struggles in sideways markets | Trending markets with steady volume patterns | Available in the LuxAlgo Library; can be paired with Price Action Concepts for structure-based confirmation |
| Volume Weighted Average Price (VWAP) | Institutional benchmark; Tracks intraday support/resistance; Reflects volume distribution | Limited to intraday analysis; Less effective in low-volume periods; Resets daily | High-volume, liquid markets during active trading hours | Can be combined with Signals & Overlays alerts for rule-based confirmations |
| Accumulation/Distribution (A/D) | Accounts for price range and volume; Detects buying/selling pressure | Susceptible to gap openings | Markets with steady trading patterns | Often used alongside oscillator-based context to reduce single-signal decisions |
| Money Flow Index (MFI) | Combines price and volume momentum; Flags overbought/oversold conditions | Needs confirmation in strong trends | Volatile markets with clear momentum shifts | Pairs well with multi-component tools like the Oscillator Matrix for confluence |
The success of volume indicators relies on accurate data. While they are often effective at describing volatility and participation, they can struggle after sharp price moves or in low-volume environments. For example, rising prices paired with declining volume often signal weakening trends and potential reversals [1][2].
LuxAlgo can improve how traders apply volume indicators by emphasizing confluence: the Oscillator Matrix provides money-flow and momentum context, while the Triangular Momentum Oscillator can help spot divergence-style behavior in real time, which may reduce the risk of acting on volume spikes that lack follow-through.
This comparison highlights how using multiple confirmations can refine volume analysis and support more consistent decisions.
Using LuxAlgo for Volume Analysis
LuxAlgo addresses common challenges associated with traditional volume indicators - like false signals, lack of context, and delayed interpretation - by providing TradingView indicators and documentation designed to turn raw market activity into more actionable context.
LuxAlgo's Indicator Library and Toolkits
LuxAlgo maintains a large indicator library and a set of exclusive TradingView toolkits that focus on confluence rather than single-indicator trading. For volume work, the key benefit is combining “where” (levels/structure) with “how” (participation/flow).
The Price Action Concepts (PAC) toolkit is particularly useful when you want to connect participation to structure. PAC can map structure shifts and highlight areas like volumetric order blocks, which traders often treat as potential reaction zones where larger participants previously showed interest.
Meanwhile, the Oscillator Matrix (OSC) toolkit focuses on trend and reversal context using multiple components, including money flow and momentum-style signals. This can help traders avoid treating a single volume spike as bullish or bearish without additional confirmation.
What makes this approach practical is layering: for example, if you notice potential exhaustion in the oscillator context, you can check whether that’s occurring near a PAC-defined structure level or around a zone where liquidity events are more likely. (LuxAlgo documents these concepts in its liquidity features and market structure pages.)
AI Backtesting for Strategy Testing
Traditional backtesting methods can be slow for discretionary volume ideas because they often require manual rules, lots of iteration, and careful validation across regimes. LuxAlgo’s AI Backtesting Assistant offers a faster loop: you can generate, test, and refine strategy logic across multiple tickers and timeframes using the platform and its supporting documentation.
Instead of spending days recreating variations of the same rule set, traders can use AI Backtesting to evaluate whether a volume condition adds signal quality (or just noise) and under which conditions it tends to work. A useful habit is to validate any “volume confirmation rule” across multiple regimes so it’s not only optimized for one environment.
For deeper capability context and updates, LuxAlgo provides both an overview page for the platform and supporting material, including an introduction in the docs and feature updates such as AI Backtesting updates.
Community Support and Learning Resources
Volume analysis can be challenging even for experienced traders, especially when the “why” behind participation is unclear. One way to improve is to study how different traders validate volume context (structure, trend, volatility, time-of-day) and how they avoid overreacting to anomalies.
LuxAlgo’s learning resources and documentation can help with implementation details, while broader market education helps you interpret what you’re seeing. The main goal is consistency: reduce “story trading” and rely on repeatable confirmations that you can test and review.
Conclusion
Volume indicators play a crucial role in technical analysis, but their limitations can’t be ignored. Issues like lack of context, susceptibility to manipulation, and misleading signals can throw strategies off track if not addressed.
Relying exclusively on volume indicators can be risky. For example, sudden volume spikes in low-liquidity markets can lead to unexpected reversals or slippage. That’s why it’s critical to confirm signals using multiple methods and to understand whether the activity is real participation or simply a temporary burst.
Platforms like LuxAlgo can support this by emphasizing confluence: market structure for context, oscillator-based signals for momentum/flow, and AI Backtesting for validation. For a practical walkthrough of how the AI Backtesting Assistant works and what it returns, see this complete breakdown.
To improve decision-making and reduce false signals, integrating volume analysis with other methods is key. Confirm participation with structure and trend context, validate what you trade, and keep your rules consistent enough to review and refine over time.
If you’re using AI Backtesting as part of your workflow, LuxAlgo’s docs also cover how strategy retrieval works in practice, including the AI Backtesting Assistant introduction.
FAQs
How can traders identify real volume spikes versus those caused by market manipulation?
To spot authentic volume spikes, traders need to consider the bigger picture of the market. Genuine spikes usually align with major events like breaking news, earnings announcements, or economic updates that logically drive higher trading activity. On the other hand, manipulated spikes often emerge out of nowhere, lacking any clear external trigger, and may coincide with unusual price behavior.
Pay attention to patterns such as sharp volume increases that don’t align with market fundamentals or spikes occurring alongside behaviors associated with spoofing or wash trading. If you want a clear investor-focused overview of dark pools and why they can reduce transparency in displayed volume, FINRA’s explainer on dark pools is a helpful reference.
How can analyzing historical volume patterns improve trading strategies?
Analyzing historical volume patterns can reveal a lot about market trends and trader behavior, offering a clearer path to refining trading strategies. For example, when volume rises during an uptrend, it often signals strong buying interest. On the flip side, if volume starts to drop, it might suggest the trend is losing steam and a reversal could be on the horizon. Volume spikes during critical moments - like breakouts or breakdowns - can also confirm these moves, helping traders steer clear of false signals.
By digging into historical data, traders can spot long-term trends and recurring short-term patterns. This deeper understanding makes it easier to pinpoint ideal entry and exit points, improving timing and boosting the chances of making successful trades.
How can platforms like LuxAlgo address the challenges of using traditional volume indicators?
Platforms like LuxAlgo address the shortcomings of traditional volume indicators by providing TradingView indicators and alerting workflows that combine price action context, volume/flow signals, and structured confirmations. This layered approach can make it easier to confirm trends and spot opportunities with more precision than volume alone.
LuxAlgo also supports AI-driven backtesting through its AI Backtesting Assistant, helping traders validate whether a volume-based condition holds up across different markets and regimes, reducing guesswork and improving repeatability.
References
LuxAlgo Resources
- Volumetric Toolkit
- Price Action Concepts (PAC)
- LuxAlgo Main Site
- LuxAlgo Library
- Signals & Overlays Alerts (Docs)
- Market Structure (PAC Docs)
- Volumetric Order Blocks (PAC Docs)
- Liquidity Features (PAC Docs)
- Sessions Indicator
- Oscillator Matrix
- Triangular Momentum Oscillator & Real-Time Divergences
- AI Backtesting Assistant (Platform)
- AI Backtesting Assistant Introduction (Docs)
- AI Backtesting Now With Millions of Trading Strategies
- Introducing LuxAlgo’s AI Backtesting Assistant (Complete Breakdown)


