Common Problems with Volume Indicators and Solutions
When a volume indicator gives a confusing signal, check the data, calculation, and trading context before adding another indicator. Volume measures activity under a particular feed’s rules. It does not reveal every participant’s identity or motivation, and a spike is not a guarantee of a breakout or reversal.
LuxAlgo combines Vela, our charting platform, with order-flow tools and Quant so you can inspect the setup and test explicit rules. Those tools make different views of activity easier to compare; they do not remove missing data, execution risk, or uncertainty. This guide covers context, manipulation concerns, timing, normalization, indicator differences, and a practical troubleshooting workflow.
Common Problems with Volume Indicators
1. Volume Does Not Explain Why Activity Changed
Earnings, economic announcements, portfolio rebalancing, forced liquidations, and ordinary trading can all contribute to activity. A candle’s volume alone cannot separate those motives. Nor does the absence of obvious news prove manipulation: the relevant cause may be unknown to you.
Start with the symbol, venue, unit, and session. A stock feed from one exchange may show less activity than a consolidated feed. Crypto volume may cover a single venue or pair. Spot-forex tick volume is feed activity, not the total amount of currency traded globally. Check LuxAlgo’s data coverage for the selected market and whether the tool needs candle or footprint data.
Extended hours are another source of mismatches. An indicator cannot analyze bars excluded from the chart’s session or absent from the feed. Comparing a regular-session series with one that includes overnight trading changes both the volume total and the baseline. Inspect session settings before interpreting the difference as a signal.
2. Manipulation, Order-Book Activity, and Dark Pools Are Different Issues
Wash trading can create misleading apparent activity without a genuine change in economic exposure. A chart may raise questions about unusual patterns, but historical price and volume alone cannot establish intent, beneficial ownership, or whether a transaction was unlawful. Avoid labeling participants based on an indicator reading.
CFTC guidance on spoofing focuses on bids or offers entered with intent to cancel before execution. Such orders can mislead observers of displayed depth. An unexecuted order is not itself a completed trade and should not directly add to traded-volume bars. Distinguish a depth imbalance from an executed-volume imbalance.
Lawful dark-pool trading is not inherently manipulation. FINRA explains that listed-stock transactions on alternative trading systems, including dark pools, are reported to a Trade Reporting Facility and published on the consolidated tape. Their pre-trade quotes are not displayed like those of a lit market. A particular chart feed may still have narrower coverage than the consolidated tape.
Algorithmic or high-frequency activity is not automatically artificial either. Real executions count as activity even if they do not express a long-term directional opinion. Validate the feed and investigate the event; additional oscillators cannot prove which actor caused a spike.
3. Calculation Lag Is Not the Same as Delayed Data
A delayed market feed delivers observations late. A smoothed indicator incorporates past observations by design. A developing bar has not finished accumulating its values. These are separate issues with different remedies.
- Delayed feed: check timestamps, market-data entitlements, and provider status.
- Indicator smoothing: inspect the lookback and formula; shortening it may increase noise rather than solve the problem.
- Unfinished bar: decide whether the rule acts intrabar or waits for close, and compare equivalent observations.
Many indicators can update while a bar forms. Their intrabar values may differ from the final historical reading. If a backtest uses final candle volume, it cannot justify an entry earlier in that candle unless the required information was actually available then.
4. Gaps, Trading Restrictions, and Thin Markets Change the Interpretation
A gap does not make all prior volume irrelevant, but it can expose weaknesses in a particular formula. For example, Accumulation/Distribution weights where the close sits within the current bar’s range and ignores the gap from the previous close. A gap-down bar can contribute positively if it closes near its own high.
Trading halts and price-limit mechanisms can restrict trading or change where transactions occur. Low observed volume during a restriction is not evidence of low interest. Check the applicable exchange and product rules rather than assuming all stocks or futures use the same daily limit system.
Thin trading presents a different challenge: a small increase from a tiny baseline can produce an impressive percentage. Look at absolute activity, spread, and available depth as well as the ratio. Historical volume does not guarantee that your order can be filled at the displayed price.
5. Raw Volume Is Hard to Compare Across Instruments
Two million shares in one stock and two million contracts in another market are not comparable exposure. Even two stocks with equal share volume can have different prices, floats, and execution conditions. Normalize only after defining what you want to compare.
For an intraday activity comparison, Relative Volume at Time illustrates how to match historical time offsets, using either individual-bar or cumulative volume. An unfinished bar is still partial. Comparing an opening burst with quiet midday observations can mistake normal session structure for an anomaly.
Solutions and Best Practices for Volume Indicators
Combine Volume with a Defined Price Setup
Use price action to specify the event: a resistance break, a support test, or a change in swing structure. Then define exactly what volume adds to that event. Avoid treating several correlated indicators as independent votes.
A doji with high volume can show substantial activity with little net change between open and close. A hammer after a decline can identify a rejected lower range. Neither candle identifies the participants involved or guarantees the next move. Require an explicit trigger and invalidation rather than declaring the pattern confirmed by volume alone.
Likewise, a break above a 50-period moving average with elevated volume is a candidate rule to test. There is no universal improvement in success probability just because the two occur together. Compare the strategy’s results with and without the volume condition.
Track Comparable Historical Activity
A 20-day average is one possible daily baseline. Suppose a completed day records 1.5 million shares versus a mean of 1.0 million over the preceding 20 completed days: relative volume is 1.5, or 50% above average. The ratio describes the observation; it does not prove the breakout is more reliable.
For intraday rules, specify session boundaries and matched elapsed time. For event studies, compare similar events while acknowledging a potentially small sample. Investigate apparent seasonal patterns in the actual instrument rather than assuming every technology or retail stock follows the same schedule.
Keep all decisions reproducible: which observations enter the average, whether the signal bar is excluded, how missing bars are handled, and when a signal becomes actionable. A missing observation should not silently become zero volume.
Use Alerts as Notifications with Explicit Conditions
Write down the exact event you want to monitor and confirm that the chosen alert system supports it. A native price alert and a strategy alert are distinct workflows. A saved Quant backtest does not by itself prove that the strategy is being monitored continuously across a watchlist.
Check the symbol, timeframe, session, trigger timing, and delivery channel. A notification is not a broker fill, and adding a webhook does not establish order execution or protective-stop handling. Keep execution and risk controls separate from the analytical signal.
Volume Indicator Comparison
| Indicator | Calculation and purpose | Common interpretation error | What to check |
|---|---|---|---|
| On-Balance Volume | Add or subtract whole-bar volume according to close-to-close direction | Treating it as actual buy-side minus sell-side executions | Ties, feed coverage, large-volume bars, corresponding price swings |
| VWAP | Volume-weighted price over an anchored window | Assuming every version resets daily or price above it means everyone is profitable | Anchor, price source, session, and candle versus execution data |
| Accumulation/Distribution | Cumulative volume weighted by the close’s location in each bar | Reading its direction as a direct measure of gap direction or cash entering the market | High-low range, gaps, and zero-range handling |
| Money Flow Index | Oscillator using typical-price changes and price multiplied by volume | Treating overbought or oversold as an automatic reversal | Lookback, volume units, threshold and signal timing |
On-Balance Volume: Whole-Bar Classification
OBV adds volume when the close rises from the preceding close and subtracts it when the close falls; an unchanged close leaves the cumulative value unchanged. The rule works on the selected chart bars, not only days.
Price making a higher high while OBV makes a lower high can highlight a disagreement. It does not specify when a reversal must happen. Review the actual bars contributing to the divergence, especially unusually large observations or data corrections.
VWAP: Check the Window
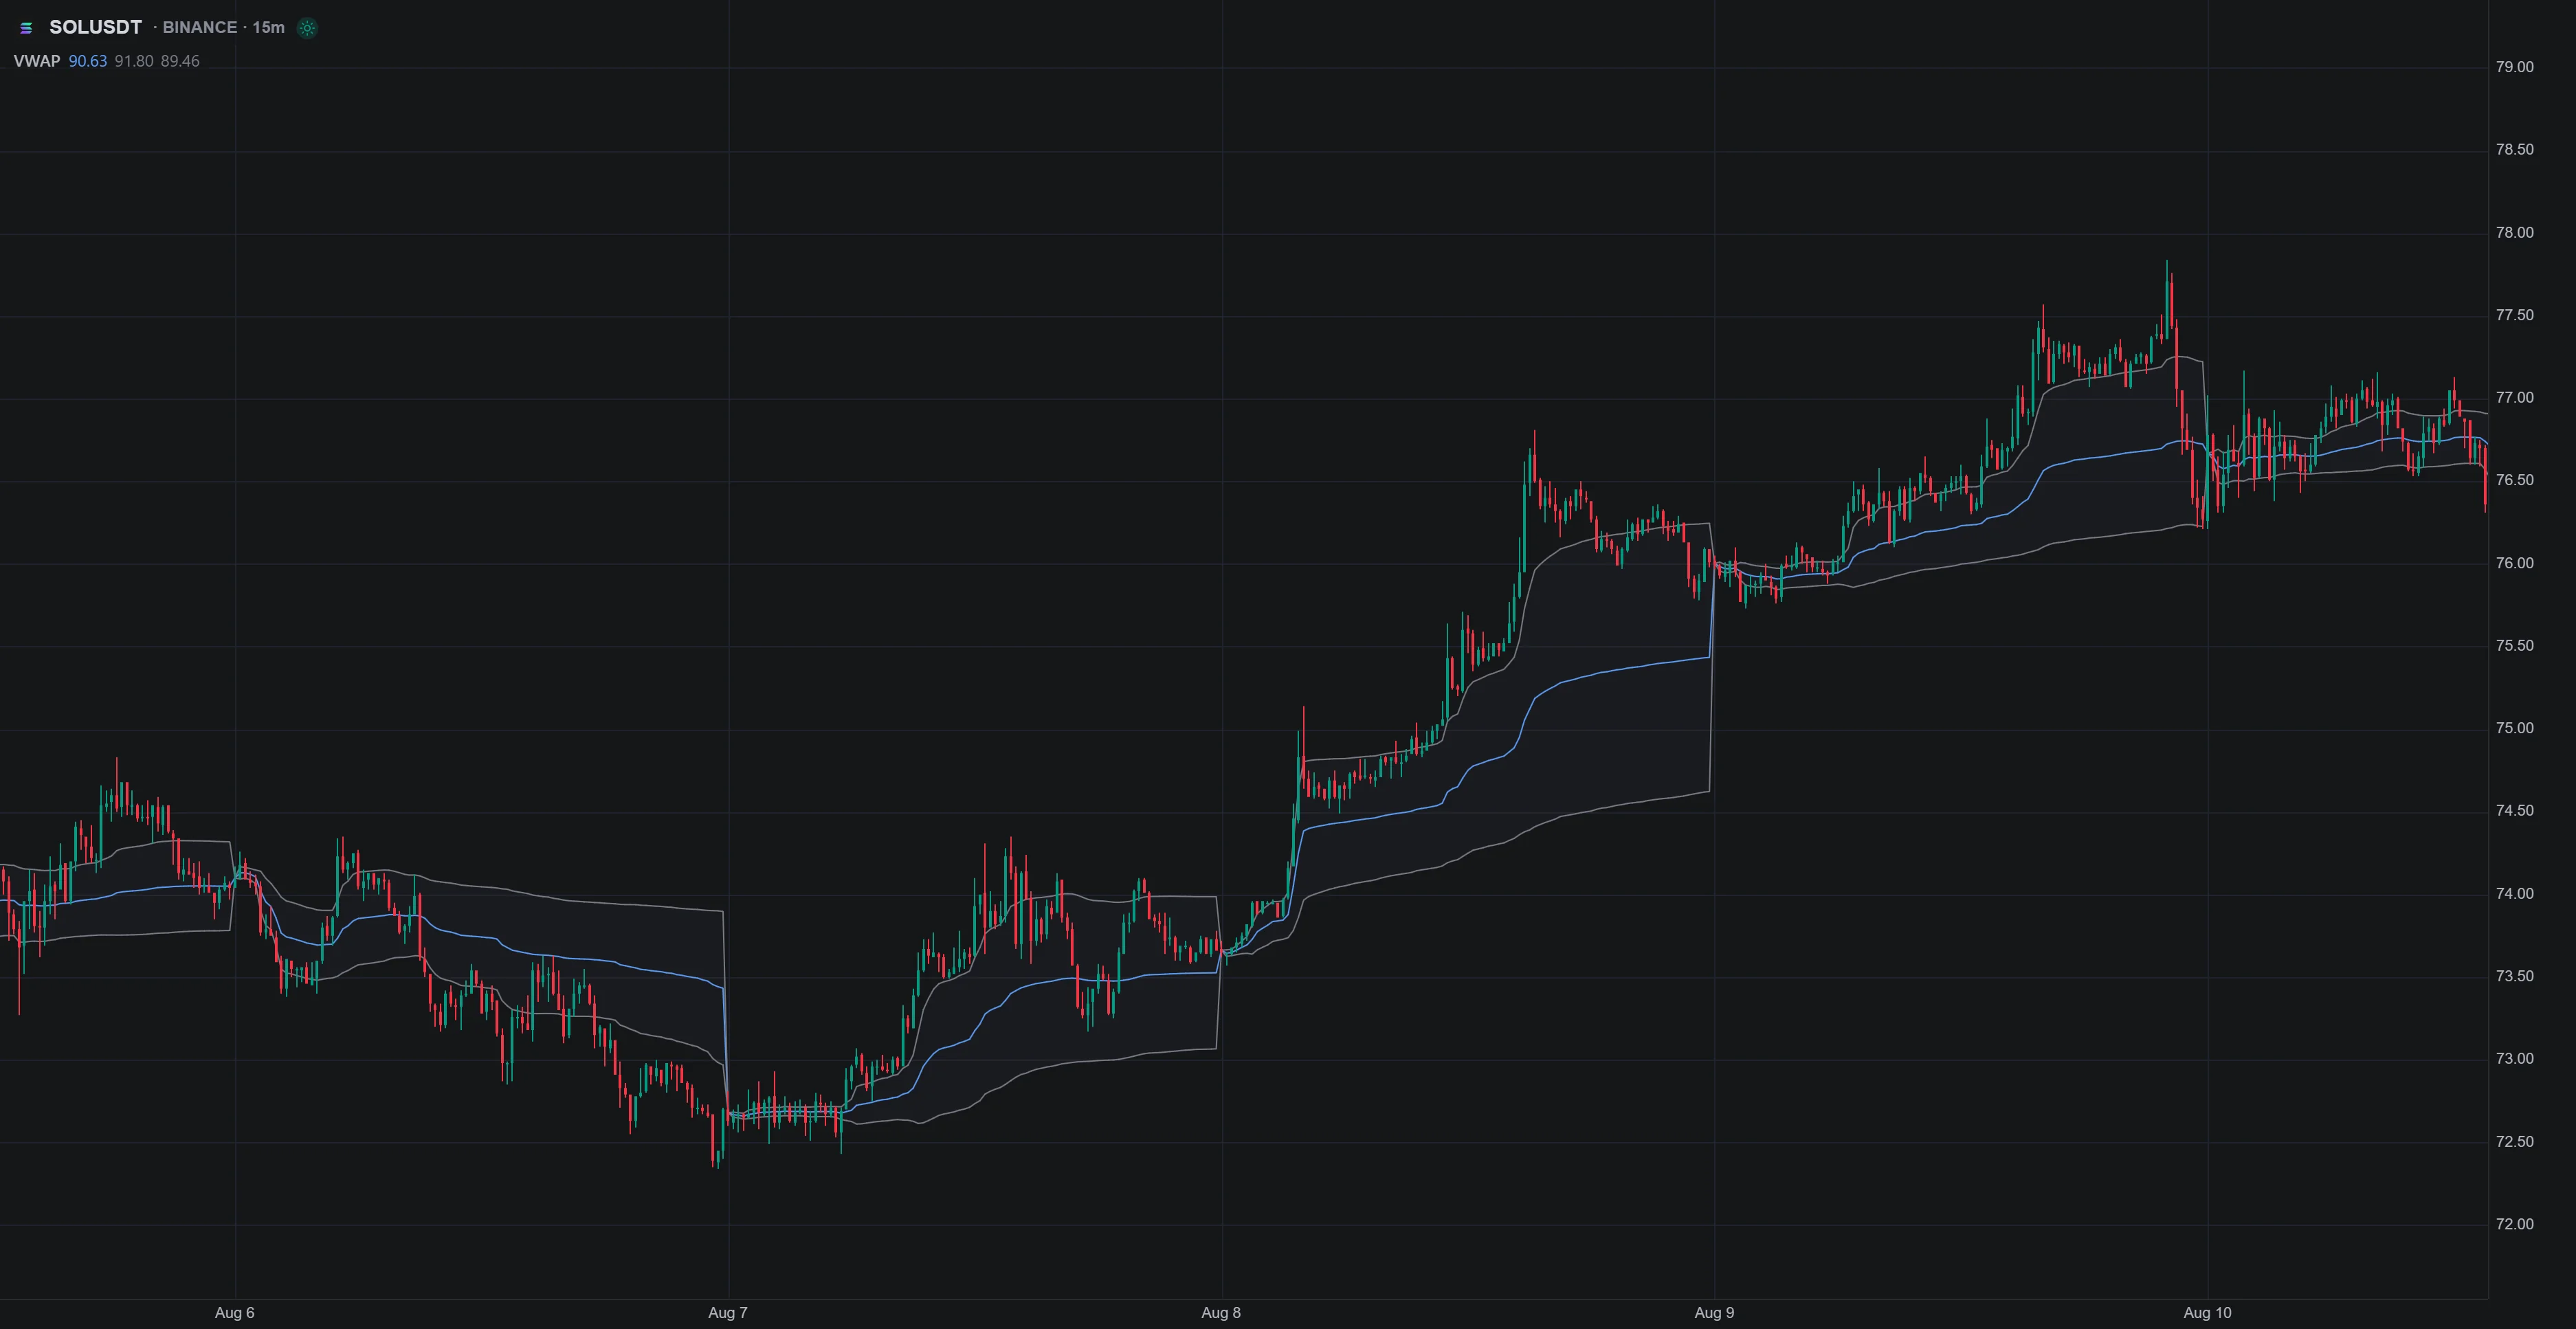
VWAP is the sum of price times volume divided by total volume over its chosen window. Candle-based versions use a selected bar price source rather than every individual trade. With 100 units at $10 and 200 at $11, an execution-based example gives $10.67.
LuxAlgo’s native VWAP offers Day, Week, and Month UTC anchors. It is not limited to one-day analysis. Price above the line is above that weighted reference; it does not reveal individual holders’ cost bases or establish a low-risk entry.
Accumulation/Distribution: Watch for Gap Effects
ADL adds each bar’s volume multiplied by ((close − low) − (high − close)) / (high − low) to the previous value. If the close is three-quarters of the way up the range, the multiplier is 0.5; 1,000 volume then contributes 500. This is weighted volume, not $500 of investment inflow. Check zero-range handling.
Because the previous close is absent from that multiplier, inspect gaps separately. ADL and OBV can disagree without either calculation being broken. Also distinguish Accumulation/Distribution from the market-breadth Advance/Decline Line.
Money Flow Index: An Oscillator, Not a Cash Ledger
MFI uses typical price, calculated from high, low, and close, multiplied by volume. It separates positive and negative contributions according to typical-price changes, then converts their ratio to a bounded oscillator. A positive-to-negative ratio of 3 gives 100 − 100 / (1 + 3) = 75.
The input remains the feed’s volume measure. On tick-volume data it is a proxy calculation, not global money entering a market. Extreme readings can persist in trends; an exit or reversal rule needs separate testing.
Using LuxAlgo to Investigate Volume Signals
Inspect Native Order Flow and the Indicator Library
Start in the Indicators menu and check the study’s source and settings. Native order-flow tools and Library indicators serve different purposes; a similar name does not establish identical calculations.
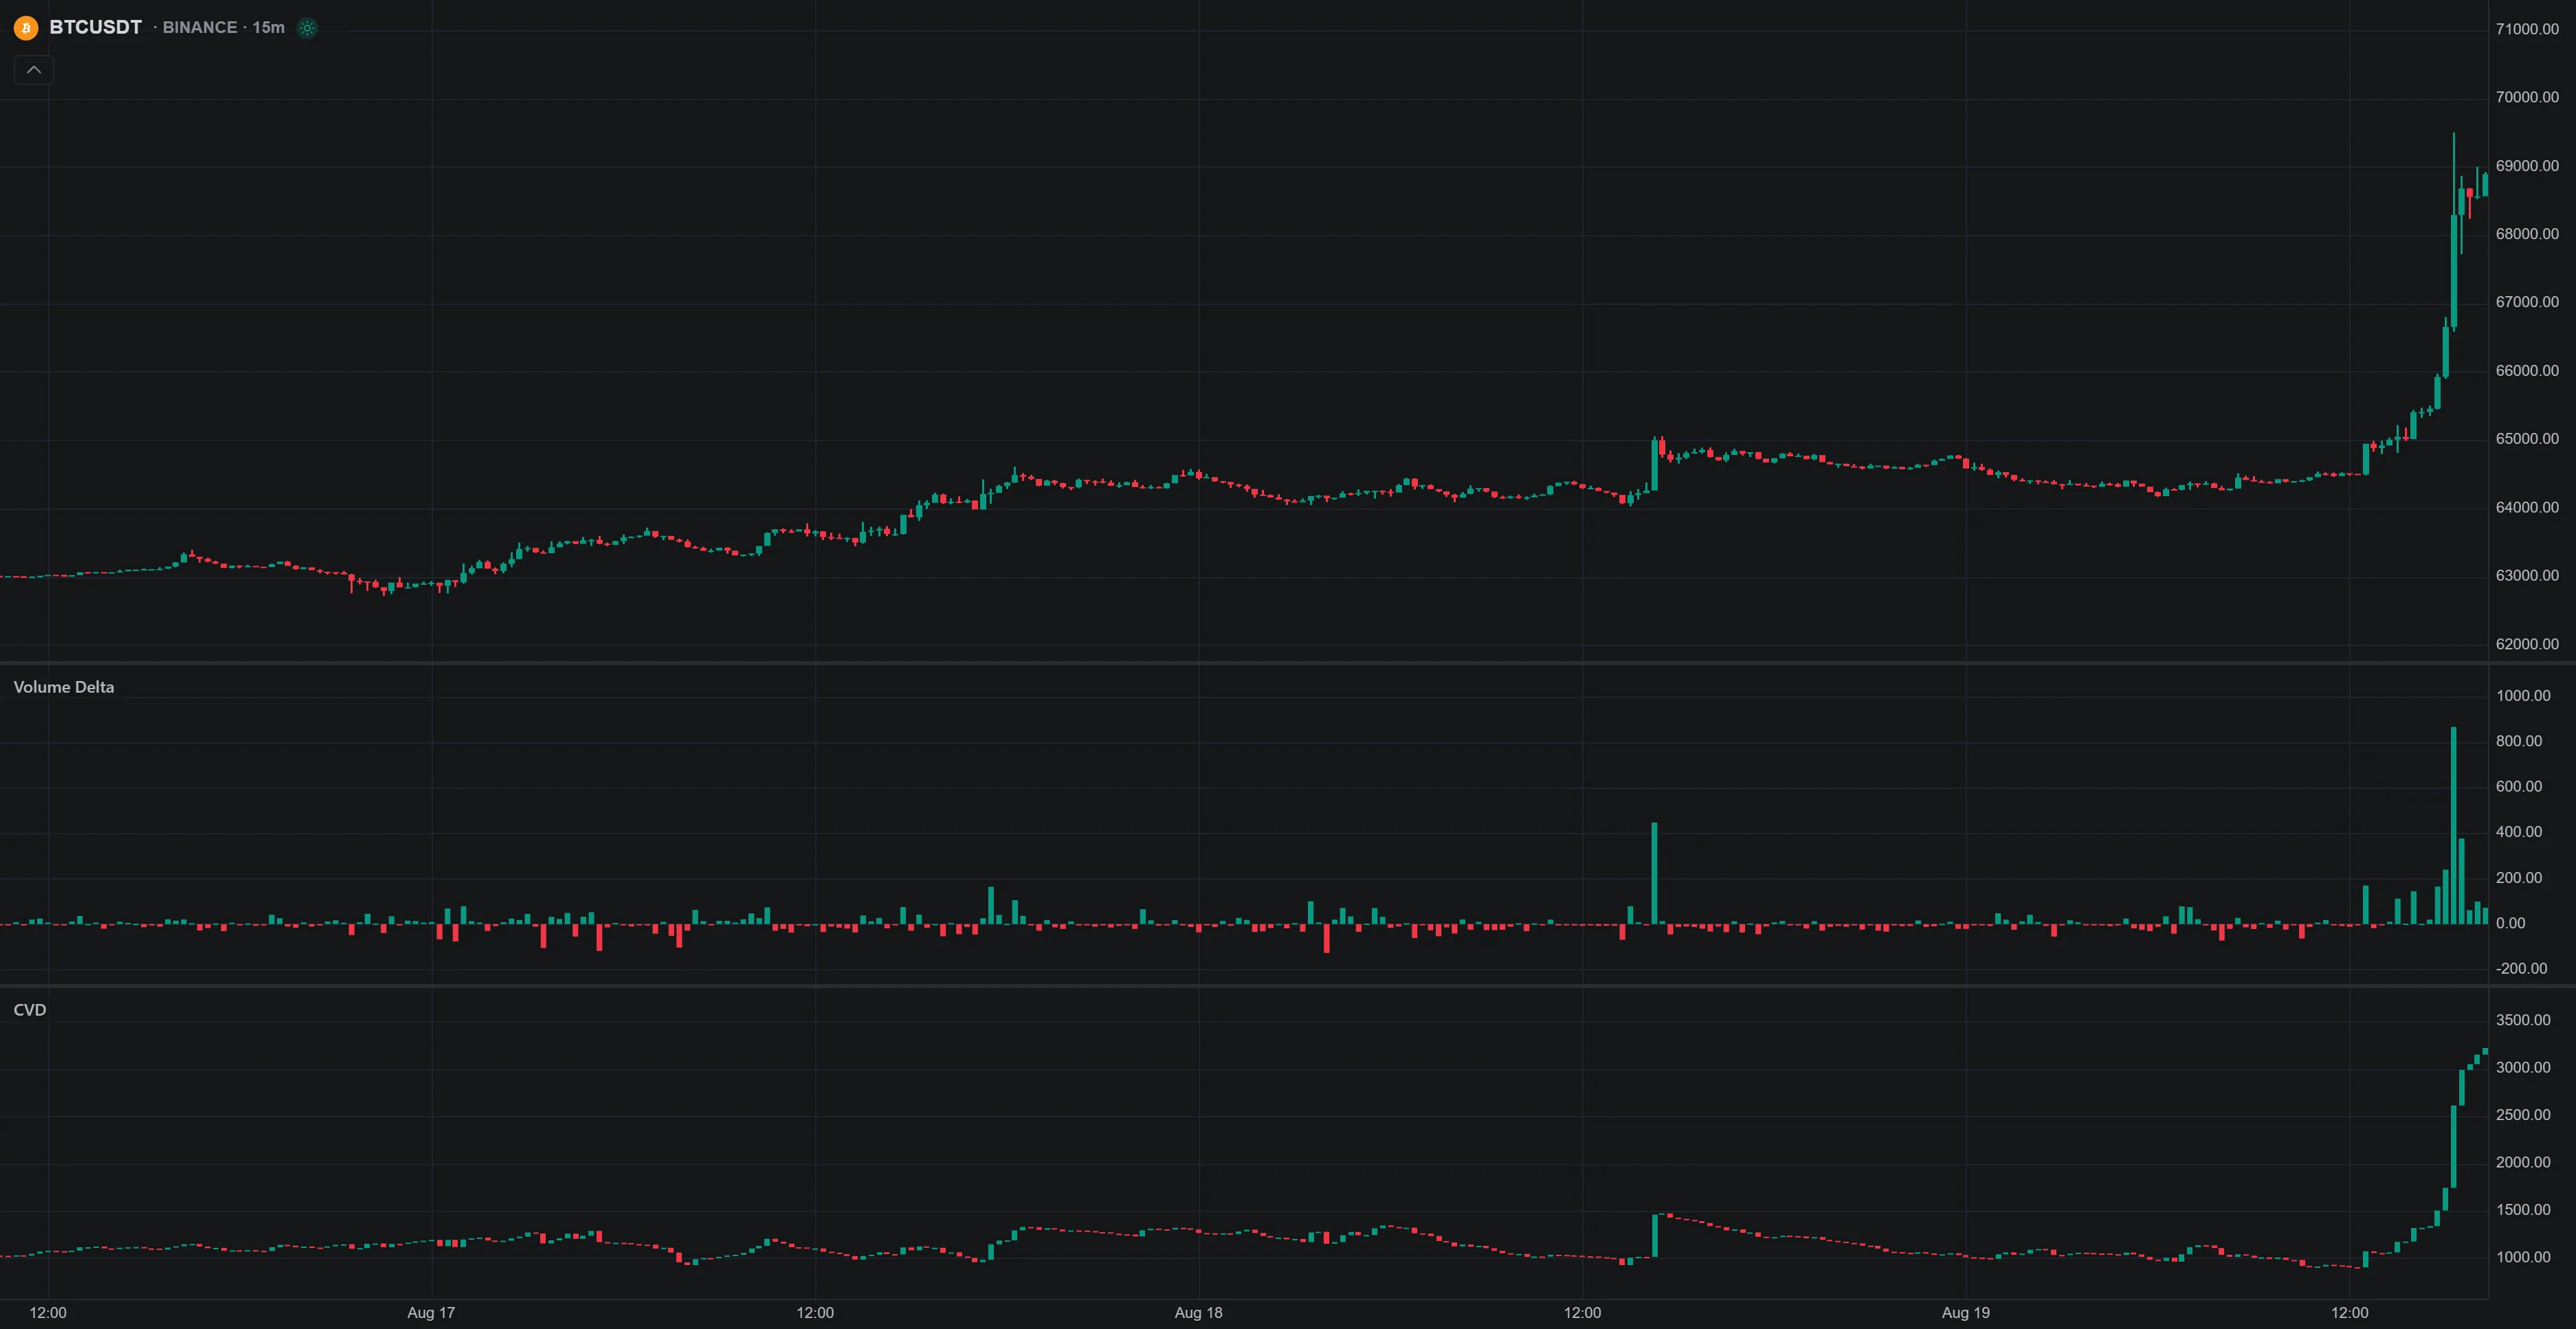
Native Volume Delta uses supported footprint data. Total mode subtracts sell-side volume from buy-side volume; Average mode compares per-side average trade sizes. Cumulative Volume Delta accumulates the selected delta over its anchor. Confirm the mode, reset, symbol coverage, and supported fixed bar interval before comparing readings. Missing trade counts can make an average unavailable rather than zero.
Volume profiles organize historical activity by price. Session and Rolling profiles require footprint data; Visible Range Volume Profile uses candle volume and changes with the visible range. A high-volume node marks historical concentration, not guaranteed current support or available resting liquidity.
A delta divergence and a profile level can be examined together on the chart, but agreement is still descriptive. These views may share underlying data and should not be treated as independent proof of a future move. Footprints summarize reported executions; they are not a complete record of every order, cancellation, or participant.
Use Quant for an Explicit Strategy Test
Quant helps turn a plain-language rule into code that you can review and run. Specify the volume formula, baseline, symbol, interval, session, entry timing, stop, target, and cancellation rule. Inspect generated code and trades; successful compilation does not validate the trading logic.
Test with realistic commission and slippage and evaluate periods outside the sample used to choose settings. Repeatedly trying alternatives on the same data can increase overfitting. A profitable historical report does not ensure live durability, and a candle-volume test cannot validate an aggressor-delta rule without the appropriate input.
If exporting code for TradingView, check runtime compatibility, available data, and results in the destination platform. Do not assume every native feature, footprint field, or proprietary calculation transfers unchanged. Use LuxAlgo’s documentation and community examples as learning resources, while verifying their settings and assumptions yourself.
A Practical Troubleshooting Checklist
- Identify the discrepancy. Record the exact symbol, time, indicator, and value that appears wrong.
- Check the source. Confirm venue, volume units, delay, missing bars, session, and any data correction or trading restriction.
- Check the calculation. Compare lookback, anchor, price source, mode, smoothing, and treatment of ties or missing inputs.
- Recreate the decision point. Separate what was visible intrabar from the completed historical candle.
- Test the rule. Compare a defined strategy with and without the volume condition, including failed signals and costs.
- Keep risk independent of confidence. A clearer chart does not automatically justify a larger position.
For example, a hypothetical $50 entry with a $49 stop and $0.10 per share of estimated costs implies $1.10 planned risk per share. A $100 budget permits 90 whole shares, or $99 of estimated risk, before capital constraints. A worse fill can exceed that estimate. Resolve the data issue and preserve the risk limit instead of trading larger to compensate for earlier false signals.
FAQs
How can traders identify real volume spikes versus those caused by market manipulation?
Volume alone cannot establish manipulation or participant intent. Check the feed, event timing, session, and available trade or order records. Unexplained activity is not proof of wash trading; unexecuted spoof orders affect displayed depth, while lawful dark-pool executions have reporting obligations.
How can analyzing historical volume patterns improve trading strategies?
Historical observations provide a baseline for measuring activity and testing a defined rule. Match comparable sessions and elapsed times, avoid using future information, and evaluate results outside the sample used to choose settings. A volume ratio describes activity but does not guarantee improved returns.
How can platforms like LuxAlgo address the challenges of using traditional volume indicators?
LuxAlgo combines native charts, order-flow tools, indicators, and Quant for inspecting data and testing explicit rules. Verify coverage, calculations, and generated code, then inspect results and execution assumptions. The platform cannot remove missing data, identify every participant, or guarantee that a signal will succeed.
References
- FINRA: Where Do Stocks Trade?
- CFTC: Antidisruptive Practices Guidance
- TradingView: Relative Volume at Time
- TradingView: On Balance Volume
- TradingView: Accumulation Distribution
- TradingView: Money Flow Index
- LuxAlgo: Data Coverage
- LuxAlgo: Volume Delta
- LuxAlgo: Volume Profiles
- LuxAlgo: Making Strategies with Quant
Read next