
Explore the cup and handle pattern, its success rates, key features, and tips for maximizing trading returns over different time frames.
The cup and handle pattern is a reliable bullish continuation pattern often leading to ongoing upward trends. It forms in two phases: a U‑shaped “cup” (1 – 6 months) and a downward‑sloping “handle” (1 – 4 weeks). Success rates improve over time, with 70 % for 1 year, 80 % for 5 years, and 85 % for 10 years. LuxAlgo’s AI Backtesting platform can automatically gauge the pattern’s historical edge in seconds. Bulkowski’s historical studies report similar win rates, especially when patterns emerge after a base‑building phase on weekly charts [5].
Key Highlights:
- Ideal Measurements: Cup depth at 38.2 – 61.8 % of the prior trend, handle slope at 10 – 15 %. Deeper cups usually need a longer right‑side recovery before breaking out.
- Volume Trends: Declines during the cup, rises during recovery, spikes at breakout. Look for volume to be at least 40 % above the 20‑period average on breakout day.
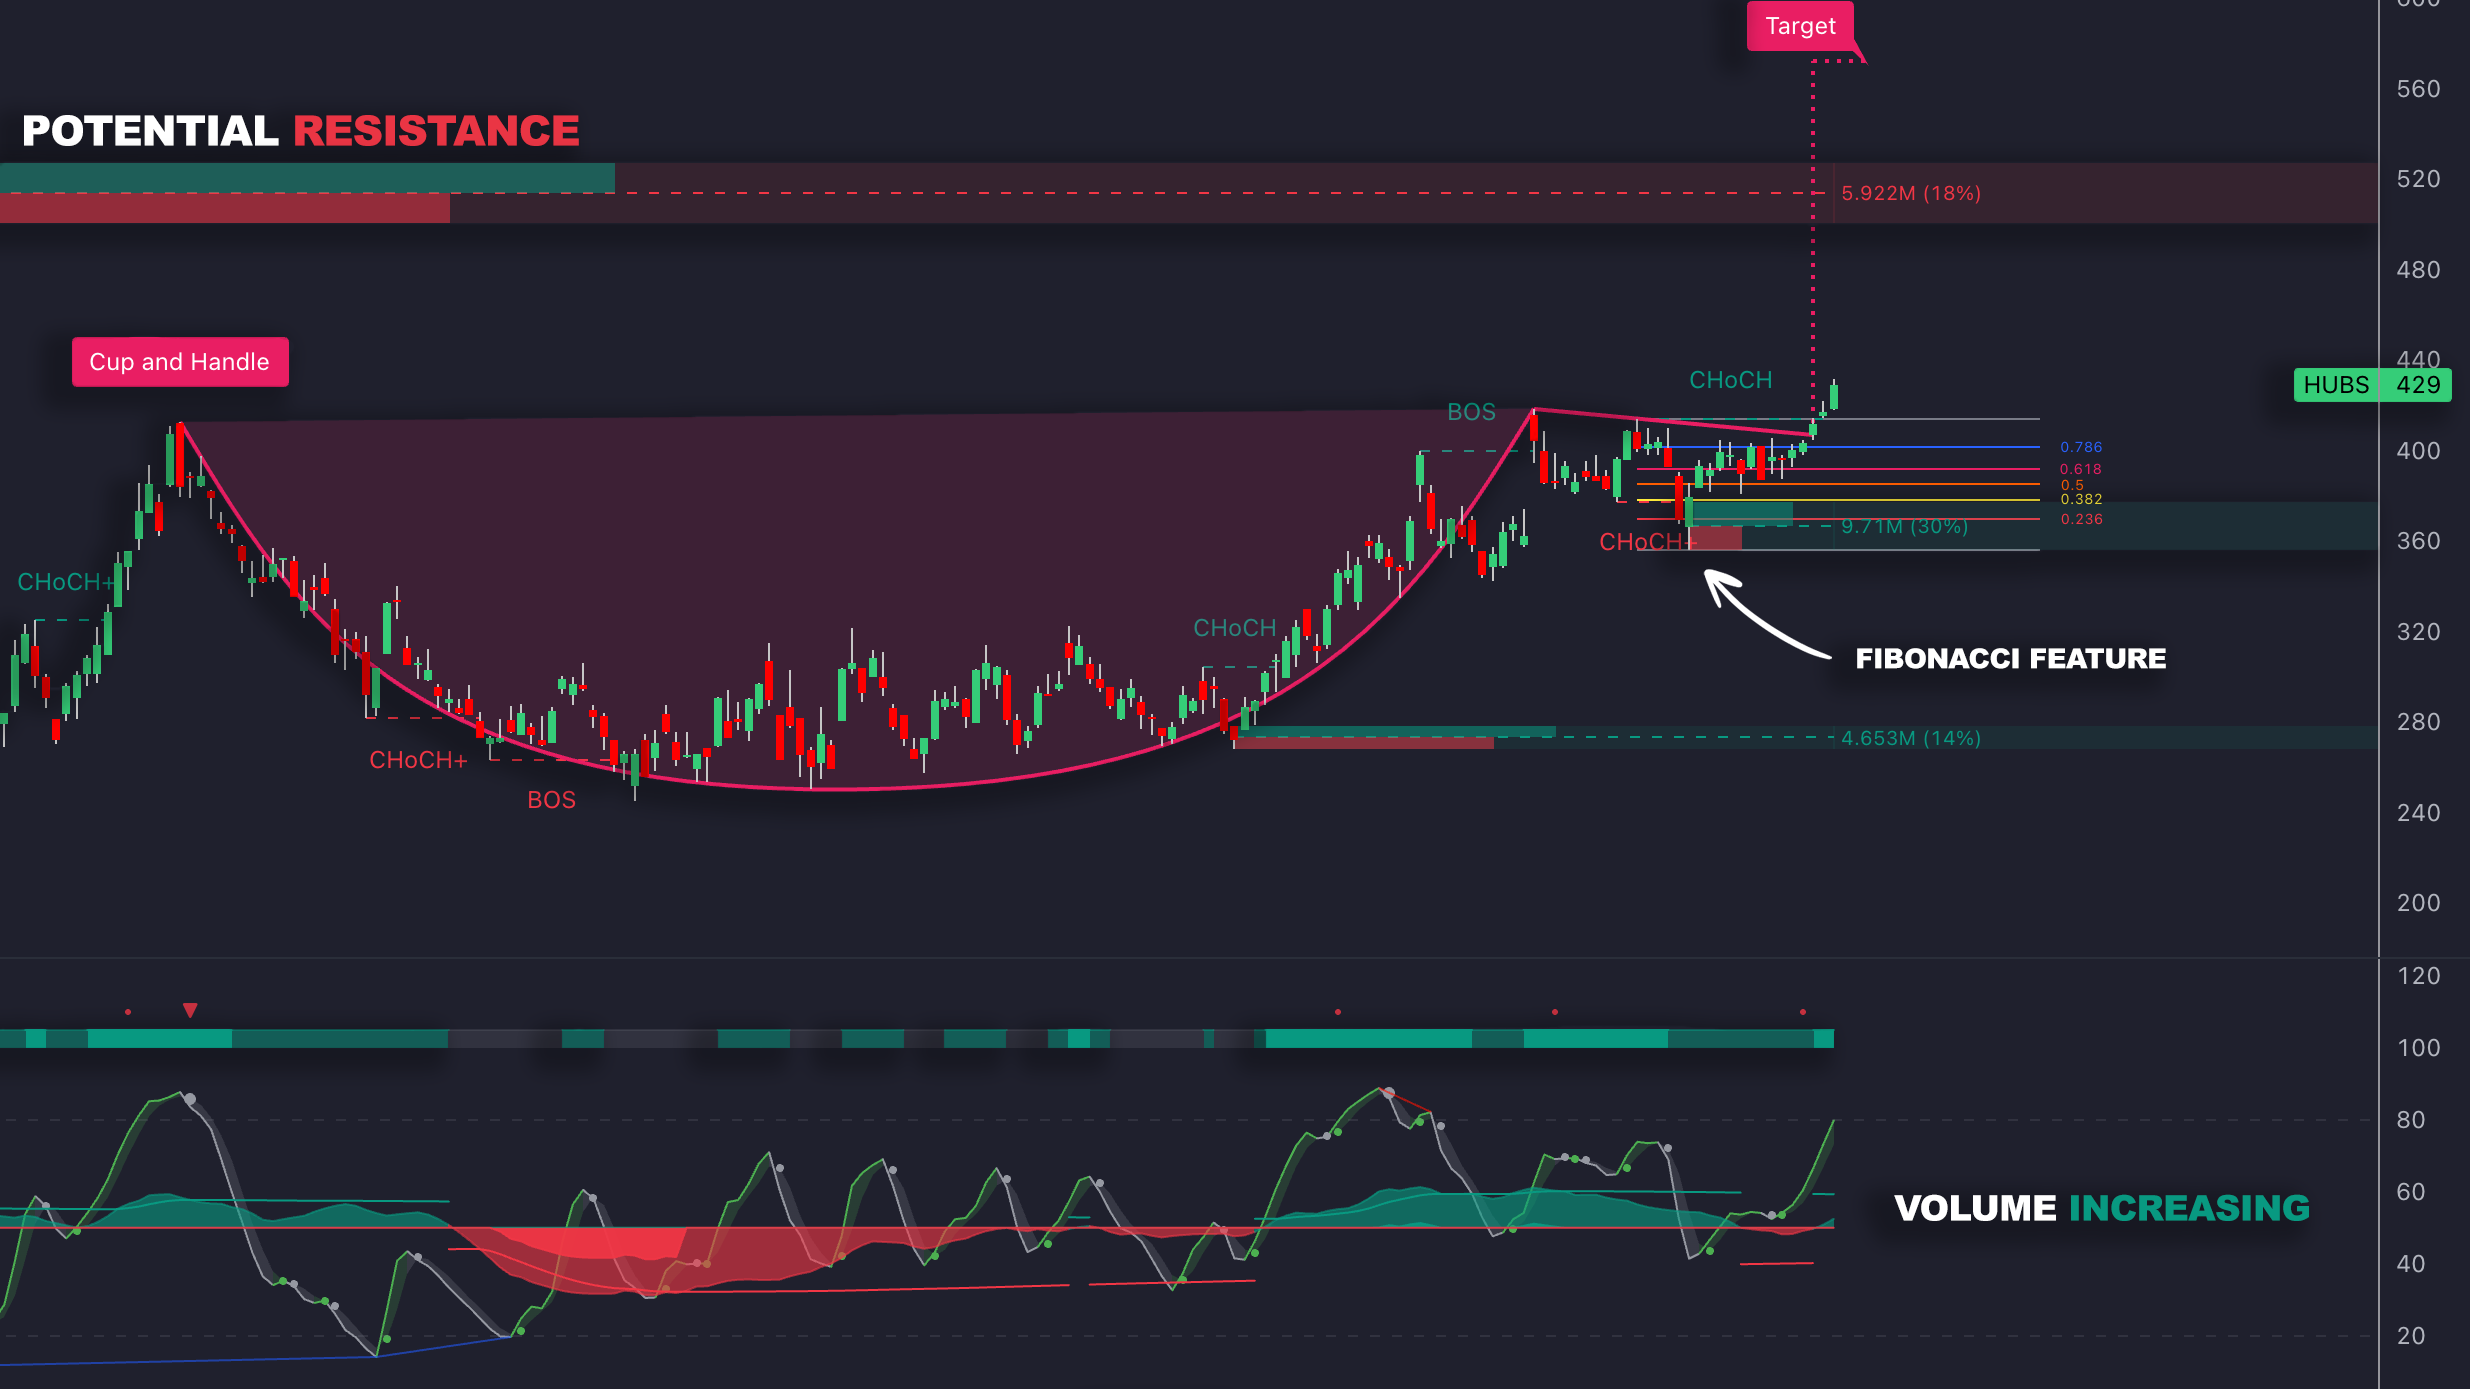
- Fibonacci Levels: Handles staying above the 50 % retracement level are more reliable.
- Risk‑Reward: Offers a 2.5 : 1 return‑to‑risk ratio, which can exceed 4 : 1 on extended moves confirmed by LuxAlgo’s SuperTrend trend filter.
Pro Tip: Look for clear volume confirmation and align with the broader market trend for better results. In equities, a rising 50‑day moving average on a major index often coincides with higher hit rates for bullish breakouts.
Key Features of the Cup and Handle Pattern

How the Cup Forms
The cup takes shape as a U‑shaped recovery following a decline. Ideally, it has a smooth, rounded bottom rather than a sharp V‑shape. For better reliability, the cup’s depth generally falls between 10 – 30 % of the pattern’s height [2]. Shallower cups may fail because sellers remain near the prior high, whereas excessively deep cups signal weak demand.
During this phase, volume decreases as selling pressure fades, then begins to rise as buyers re‑enter the market. These volume patterns help confirm the validity of the formation [2][3]. LuxAlgo’s Volume Distribution indicator color‑codes buying vs. selling pressure inside the cup, giving an objective view of accumulation.
How the Handle Forms

The handle appears as a downward‑sloping consolidation phase after the cup is complete. It typically slopes down by 10 – 15 %, lasts 1 – 4 weeks, and stays within the upper half of the cup. The handle’s depth should not exceed 50 % of the cup’s depth [2][3]. Handles that drift lower on rising volume often fail because they reveal hidden distribution.
This handle phase reflects short‑term profit‑taking before a potential breakout. Prices generally remain above the 50 % Fibonacci retracement level of the cup’s depth during this time.
Volume Trends in the Pattern
Volume plays a critical role in confirming the pattern. It usually declines during the cup’s descent, reaches its lowest point at the bottom, and then rises as the recovery begins. During the handle, volume decreases again but spikes sharply at breakout [2].
When these volume trends align with the pattern, they serve as a strong indicator of its reliability for predicting future price movements [2][3]. A breakout accompanied by a 50 % or greater increase in On‑Balance Volume (OBV) versus the prior week tends to follow through.
Although these characteristics define the pattern, external market factors such as earnings releases, macroeconomic data, or sudden changes in risk sentiment can impact its effectiveness as a predictive tool.
Historical Success Rates of the Cup and Handle Pattern

Success Rates by Time Frame
The cup and handle pattern tends to perform better over longer time frames. For short‑term trading (1 year) it has a 70 % success rate, while medium‑term trading (5 years) sees this rise to 80 %, and long‑term trading (10 years) achieves 85 % success [1]. These averages assume proper pattern symmetry, adequate volume confirmation, and alignment with the prevailing trend.
| Time Frame | Success Rate |
|---|---|
| Short‑term (1 year) | 70 % |
| Medium‑term (5 years) | 80 % |
| Long‑term (10 years) | 85 % |
Market Conditions and Other Factors
The pattern is most effective when it aligns with the primary trend, displays proper formation characteristics, and shows increasing volume during the handle phase. Traders who rely on LuxAlgo’s Signals & Overlays toolkit often use its automatic trend filters to avoid setups that run counter to the larger move. Backtests show that filtering out patterns occurring below a declining 200‑day moving average cuts failure rates nearly in half.
Performance in Stocks, Crypto, and Forex
The cup and handle pattern behaves differently across asset classes like stocks, cryptocurrencies, and forex. Complementary indicators from the Oscillator Matrix toolkit and detailed volume metrics can help traders pinpoint high‑probability setups. With a return‑to‑risk ratio of 2.5 : 1 [4], this pattern offers a solid framework for managing positions.
To validate the pattern, traders should focus on:
- Volume trends: Ensure volume supports the pattern’s formation.
- Price action: Look for a clean and well‑defined pattern — LuxAlgo’s Pattern Detection indicator can highlight it automatically.
- Technical tools: Use additional indicators to confirm breakout signals.
- Time‑of‑day filters: In forex, London‑New York overlap sessions often show stronger follow‑through than Asian hours.
Tips for Using the Pattern in Trading

Finding Entry and Exit Points
The pattern boasts historical success rates of up to 85 % over long‑term timeframes, making precise entry and exit strategies critical. The ideal entry occurs when the price breaks above the handle’s resistance, confirmed by strong trading volume [2]. For exits, aim for a 2.5 : 1 ratio and set a stop loss just below the handle’s low to guard against false breakouts; LuxAlgo’s Liquidation Levels indicator helps automate this placement.
Advanced approach: trail half the position with the SuperTrend or a 21‑period exponential moving average to capture extended moves.
Using Volume to Confirm Trades
Volume analysis is key. Here’s the typical volume profile at each stage:
| Pattern Stage | Expected Volume |
|---|---|
| Cup Formation | Decreasing |
| Cup Bottom | Low |
| Right Side of Cup | Increasing |
| Handle Formation | Lower than the cup |
| Breakout | Higher than average |
During consolidation phases, volume usually declines, while breakouts are marked by a volume spike. This surge confirms buying interest [2][3]. LuxAlgo’s Volume Distribution indicator simplifies tracking these spikes.
How LuxAlgo Can Help
LuxAlgo offers advanced indicators and exclusive tools to streamline cup‑and‑handle analysis:
- Volume profile analysis gauges how much interest supports each leg of the pattern.
- Built‑in Fibonacci tools inside Price Action Concepts automatically plot key retracement zones.
- AI Backtesting Assistant pressure‑tests the pattern across thousands of scenarios.
- Money Flow and Volume Delta reveal when institutional participation confirms the breakout.
- SuperTrend helps manage positions once the breakout accelerates.
Because all toolkits — Signals & Overlays, Price Action Concepts, and Oscillator Matrix — integrate directly on TradingView, traders can layer multiple confirmations without leaving the chart.
Conclusion and Final Thoughts
Key Points Recap
The cup and handle pattern works best on longer timeframes, with success rates as high as 85 % over a 10‑year span. Reliability hinges on proper formation duration, retracements that respect Fibonacci levels from Price Action Concepts, and clear volume confirmation.
To validate the pattern effectively, traders should:
- Match setups with the overall market trend
- Watch for volume spikes during breakouts
- Ensure the handle forms above the 50 % retracement level
- Use stop‑loss logic, such as Liquidation Levels, to manage risk
Advice for Traders
Focus on higher‑timeframe charts where the pattern’s reliability is greatest. Combine disciplined risk management with LuxAlgo’s indicators — notably risk‑management guidelines — to improve consistency. Consider journaling each trade to refine entry timing, stop placement, and exit tactics.
FAQs
This section answers common questions about the cup and handle pattern.
What are the success rates and odds of the cup and handle pattern?
Analysis of more than 3 000 instances shows a baseline success rate of 49 % [4]. Longer holding periods can lift this to 85 % [1]. The 2.5 : 1 return‑to‑risk profile means that, even with a sub‑50 % win rate, disciplined traders can still achieve positive expectancy.
Boost your odds by:
- Using higher‑timeframe charts
- Confirming patterns with volume and breakout signals
- Applying Fibonacci retracement techniques
- Practicing disciplined risk management
How do you calculate the price target?
Measure the distance from the cup’s rim to its lowest point and add that value to the breakout level. Aggressive traders may also project a secondary target at 1.618 × the cup depth, aligning with the golden ratio extension used in Price Action Concepts.
References
- Financial Source – Cup and Handle Pattern
- Alchemy Markets – Cup & Handle Strategy
- Strike Money – Cup and Handle
- Bapital – Chart Patterns: Cup & Handle
- Wikipedia – Fibonacci Retracement
- Investopedia – Cup and Handle Definition
- StockCharts – Cup with Handle Pattern
- LuxAlgo – AI Backtesting Platform
- LuxAlgo Docs – PAC Fibonacci Tools
- LuxAlgo Docs – Price Action Concepts
- LuxAlgo Docs – Signals & Overlays Toolkit
- LuxAlgo Docs – Oscillator Matrix Toolkit
- LuxAlgo Indicator – Range Breakout Signals
- LuxAlgo Indicator – Liquidation Levels
- LuxAlgo Indicator – Pattern Detection
- LuxAlgo Indicator – Volume Distribution
- LuxAlgo Docs – AI Backtesting Assistant
- LuxAlgo Indicator – Money Flow
- LuxAlgo Indicator – Volume Delta
- LuxAlgo Indicator – SuperTrend
- LuxAlgo Blog – Risk Management
- LuxAlgo – Official Website