
Explore how the Directional Movement Index (DMI) can enhance your trading strategies by evaluating market trends and momentum effectively.
The Directional Movement Index (DMI) is a technical indicator that helps traders identify market trends by analyzing price movements. Introduced by J. Welles Wilder Jr. in 1978, it consists of three key components:
- +DI (Positive Directional Indicator): Tracks upward price momentum.
- -DI (Negative Directional Indicator): Tracks downward price momentum.
- ADX (Average Directional Index): Measures the strength of a trend, regardless of its direction.
Key Points
- +DI above -DI: Indicates bullish momentum (buying pressure).
- -DI above +DI: Indicates bearish momentum (selling pressure).
- ADX above 25: Confirms a strong trend; below 20 suggests weak or no trend.
- Crossovers: When +DI crosses above -DI (or vice versa), it signals potential changes in trend direction.
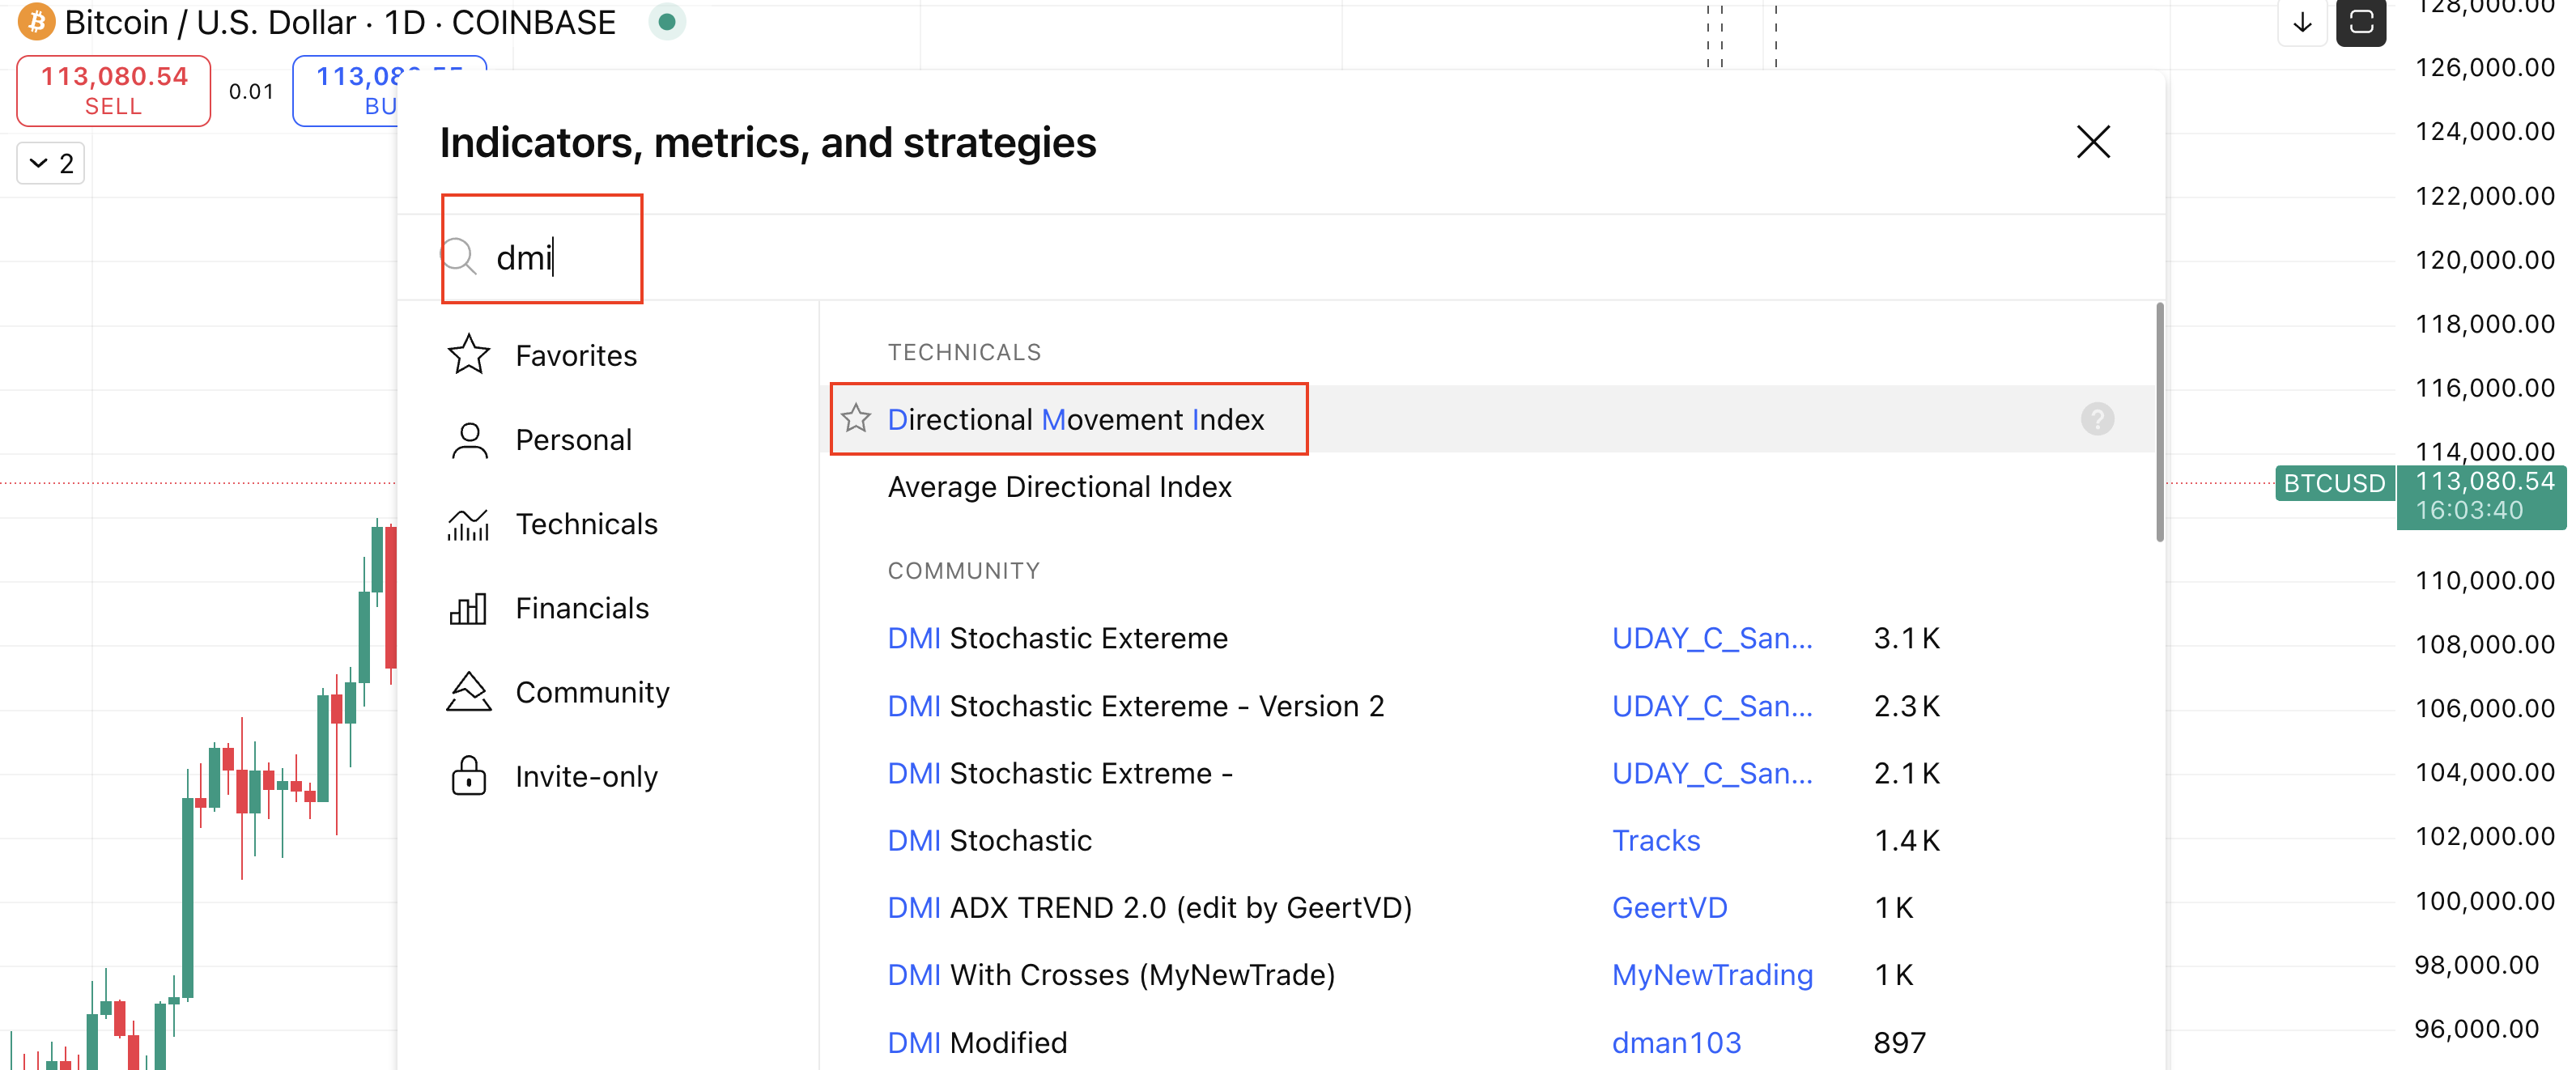
Using DMI effectively involves combining these signals, monitoring ADX for trend strength, and avoiding trades in low-trend conditions. LuxAlgo provides TradingView-compatible tools that simplify analysis with custom settings, alerts, and backtesting capabilities. You can chart and test DMI-based ideas directly on TradingView.
Pro Tip: Always confirm signals with other indicators and adjust strategies based on market conditions to reduce false signals.
DMI Components and How They Work
The +DI and -DI Lines
At the core of the Directional Movement Index (DMI) system are the Positive Directional Indicator (+DI) and Negative Directional Indicator (-DI). These two lines measure the strength of upward and downward price movements over a set period, commonly 14 days.
The +DI line reflects bullish momentum, highlighting periods when the current high surpasses the previous high. Strong upward moves push this line higher. On the other hand, the -DI line tracks bearish momentum, focusing on periods when the current low dips below the previous low, with sustained selling pressure driving the line upward. When either indicator rises above 25, it typically signals meaningful directional pressure in the market.
Here’s how they interact: when the +DI line moves above the -DI line, it indicates that buying pressure is dominant. Conversely, when the -DI line overtakes the +DI line, selling pressure takes the lead. The gap between the two lines reveals the strength of the directional bias—the wider the gap, the stronger the trend.
The next component, the Average Directional Index (ADX), ties these signals together by assessing the overall strength of the trend. For additional background on ADX interpretation and calculations, see this overview from Investopedia.
The Average Directional Index (ADX)
The Average Directional Index (ADX) focuses on trend strength, ignoring whether the trend is upward or downward. While the +DI and -DI lines show which side—bulls or bears—is winning, the ADX tells us how intense the trend is.
ADX values range from 0 to 100:
- Below 20: Weak trend
- 20–25: Emerging trend
- 25–50: Strong trend
- Above 50: Very strong trend
When the ADX rises, it signals that the trend is gaining strength, regardless of its direction. For example, whether prices are climbing or dropping, a rising ADX confirms growing momentum. On the flip side, a falling ADX warns that the trend’s momentum is fading. While this doesn’t always mean an immediate reversal, it’s often a sign to reassess positions. Traders frequently interpret a declining ADX as a cue to adjust stop-losses or reduce exposure. If you’re new to stop-loss mechanics, this primer on stop-loss orders is helpful.
How the Components Work Together
Now that each component is defined, let’s see how they work together to clarify market trends. The ADX, +DI, and -DI lines combine to offer a full picture of both trend direction and strength.
- In strong trending markets, the ADX typically rises above 25, and there’s a clear separation between the +DI and -DI lines.
- In sideways or choppy markets, the ADX stays below 20, and the +DI and -DI lines frequently cross without either establishing dominance.
- During trend transitions, divergence between the ADX and DI crossovers often signals weakening trends.
Crossover timing is especially important. For instance, when the +DI line crosses above the -DI line and the ADX rises past 20, the signal carries more weight than if the ADX remains flat or declining. This interplay helps traders avoid being caught in false signals during periods of consolidation and ensures they stay in profitable trades during strong trends.
Reading DMI Signals for Trading
Spotting Bullish and Bearish Signals
Traders often look at the interaction between the +DI and -DI lines to determine market direction. A bullish signal emerges when the +DI line moves above the -DI line, signaling growing buying strength. On the flip side, a bearish signal occurs when the -DI line crosses above the +DI line, indicating increasing selling pressure. For added confidence, many traders wait until the ADX reading surpasses 25, which suggests a stronger trend. Those with a higher risk tolerance may act when the ADX exceeds 20. This approach helps validate the crossovers before making a move.
Measuring Trend Strength with ADX
The ADX adds another layer to the DMI by measuring how strong the current trend is. When the ADX reads above 25, it confirms solid momentum in the trend, making it a reliable signal. For traders willing to take on more risk, an ADX above 20 can also indicate enough strength to act. This measurement ensures that any DI crossover is backed by sufficient trend momentum, reducing the likelihood of false signals. For additional context on momentum concepts, see this overview of momentum indicators.
Using LuxAlgo with DMI on TradingView
LuxAlgo can be used alongside the built-in DMI indicator on TradingView to create a more robust trading workflow. While the DMI provides insight into directional strength and momentum, LuxAlgo’s Library adds complementary features like dynamic support and resistance, signal overlays, and automated alerts. These tools allow traders to confirm DI crossovers with broader market structure insights, reducing noise and filtering out false signals.
For example, when the +DI crosses above the -DI, LuxAlgo’s Support & Resistance levels can highlight whether price action is breaking through a key zone, making the signal more reliable. Traders can also use Signals & Overlays to automatically highlight strong crossover opportunities, combined with real-time alerts. This synergy makes managing trades more efficient and helps refine entries and exits when applying DMI-based strategies.
Conclusion: Using DMI for Better Trend Analysis
Key Takeaways
The Directional Movement Index (DMI) is a valuable indicator for understanding market trends. It goes beyond tracking price movements by helping traders identify whether bulls or bears are in control and measuring the strength of that control.
The indicator’s three components—+DI, -DI, and ADX—work together to confirm both the direction and intensity of a trend. It’s versatile, performing well across different markets and timeframes, with traders often tweaking the period settings to suit their strategies.
Experienced traders don't rely on DMI alone. They often combine its signals with other tools like support and resistance levels, volume analysis, and confirmations from multiple timeframes. This multi-layered approach helps reduce false signals and builds confidence in trade decisions. However, it’s important to remember that while DMI identifies trends, it doesn’t predict how long those trends will last. Proper risk management—using tools like stop losses and thoughtful position sizing—is essential to protect against unexpected moves. For a quick refresher on RSI/MACD confirmation, see RSI and MACD.
These strategies offer a framework for refining your trading techniques.
Next Steps for Traders
Start incorporating DMI into your trading process with LuxAlgo resources. The free Library covers fundamentals, while premium access unlocks advanced customization and automation for more sophisticated strategies.
Use backtesting tools to test DMI rules before committing to live trades. Set up alerts for key DI/ADX events to stay on top of opportunities. If you prefer conversational setup and rapid iteration, try the AI Backtesting Assistant.
For broader market analysis, leverage screeners and strategy features to monitor multiple markets simultaneously. Alerts for critical signals help ensure you don’t miss important setups. As market dynamics shift, regularly review and adjust your DMI approach using backtesting to keep it effective.
ADX & DMI Indicator: Settings, Uses, and 3 Powerful Strategies
FAQs
How can traders combine the DMI indicator with other tools to improve their trading strategies?
Traders can refine their strategies by combining the Directional Movement Index (DMI) with other technical indicators to gain a clearer picture of market trends. For example, pairing the DMI with the Relative Strength Index (RSI) not only confirms trend strength but also highlights overbought or oversold conditions. This combination can lead to better-timed entry and exit points. A primer on RSI is available here: Relative Strength Index (RSI).
Another effective pairing is the DMI with the Moving Average Convergence Divergence (MACD). This duo helps verify both the direction of a trend and its momentum, reducing the chances of acting on false signals. By integrating these tools, traders can validate signals more effectively and build more precise trend-following strategies. Additionally, the ADX line within the DMI serves as a helpful filter, allowing traders to determine if a trend is strong enough to warrant action. Learn more about MACD here: What Is MACD?
What are some common mistakes traders make when using the DMI indicator, and how can they avoid them?
One frequent misstep traders encounter with the Directional Movement Index (DMI) is relying on it exclusively to make trading decisions. While the DMI is excellent for assessing the strength and direction of a trend, it doesn't pinpoint exact entry or exit points. Misusing it in this way can result in flawed trades.
To steer clear of these issues, pair the DMI with other technical indicators or analytical tools for confirmation. It's also crucial to grasp the DMI's components—like the ADX line, +DI, and -DI—and understand how they work together to indicate trend dynamics. Incorporating the DMI into a more comprehensive trading strategy can help you make better-informed decisions and minimize potential mistakes.
How can I customize LuxAlgo's tools on TradingView to enhance the DMI indicator for different market conditions?
You can tweak LuxAlgo’s TradingView tools to fine-tune DMI-style analysis, adjusting elements like bar colors, alert preferences, and background themes. These changes simplify how you interpret trend strength and direction, whether the market is trending or experiencing volatility.
You can also adjust key levels and other display settings to make signals easier to read and act on faster. By customizing these features, DMI-based logic can better align with your trading approach, helping you make more accurate and well-informed decisions.
References
LuxAlgo Resources
- LuxAlgo — Official Site
- Indicator Library
- Backtester (S&O)
- Backtesters — Feature Overview
- AI Backtesting Assistant
- AI Backtesting — Documentation
- Alert Scripting Update: Actions
- Backtester Alerts — Docs
- S&O Backtester — TP/SL Settings
- OSC Backtesting — TP/SL Settings
- Trend Starter
- Multi Timeframe Market Formation
- Support & Resistance Dynamic
- Adaptive MACD
- Trendlines with Breaks


