
Learn how institutional activity in Forex creates sharp price movements and how to identify key trading opportunities through displacement.
Forex displacement reveals institutional activity through sharp price moves and liquidity manipulation. Understanding these patterns helps traders identify key market opportunities and avoid common pitfalls. Here’s what you need to know:
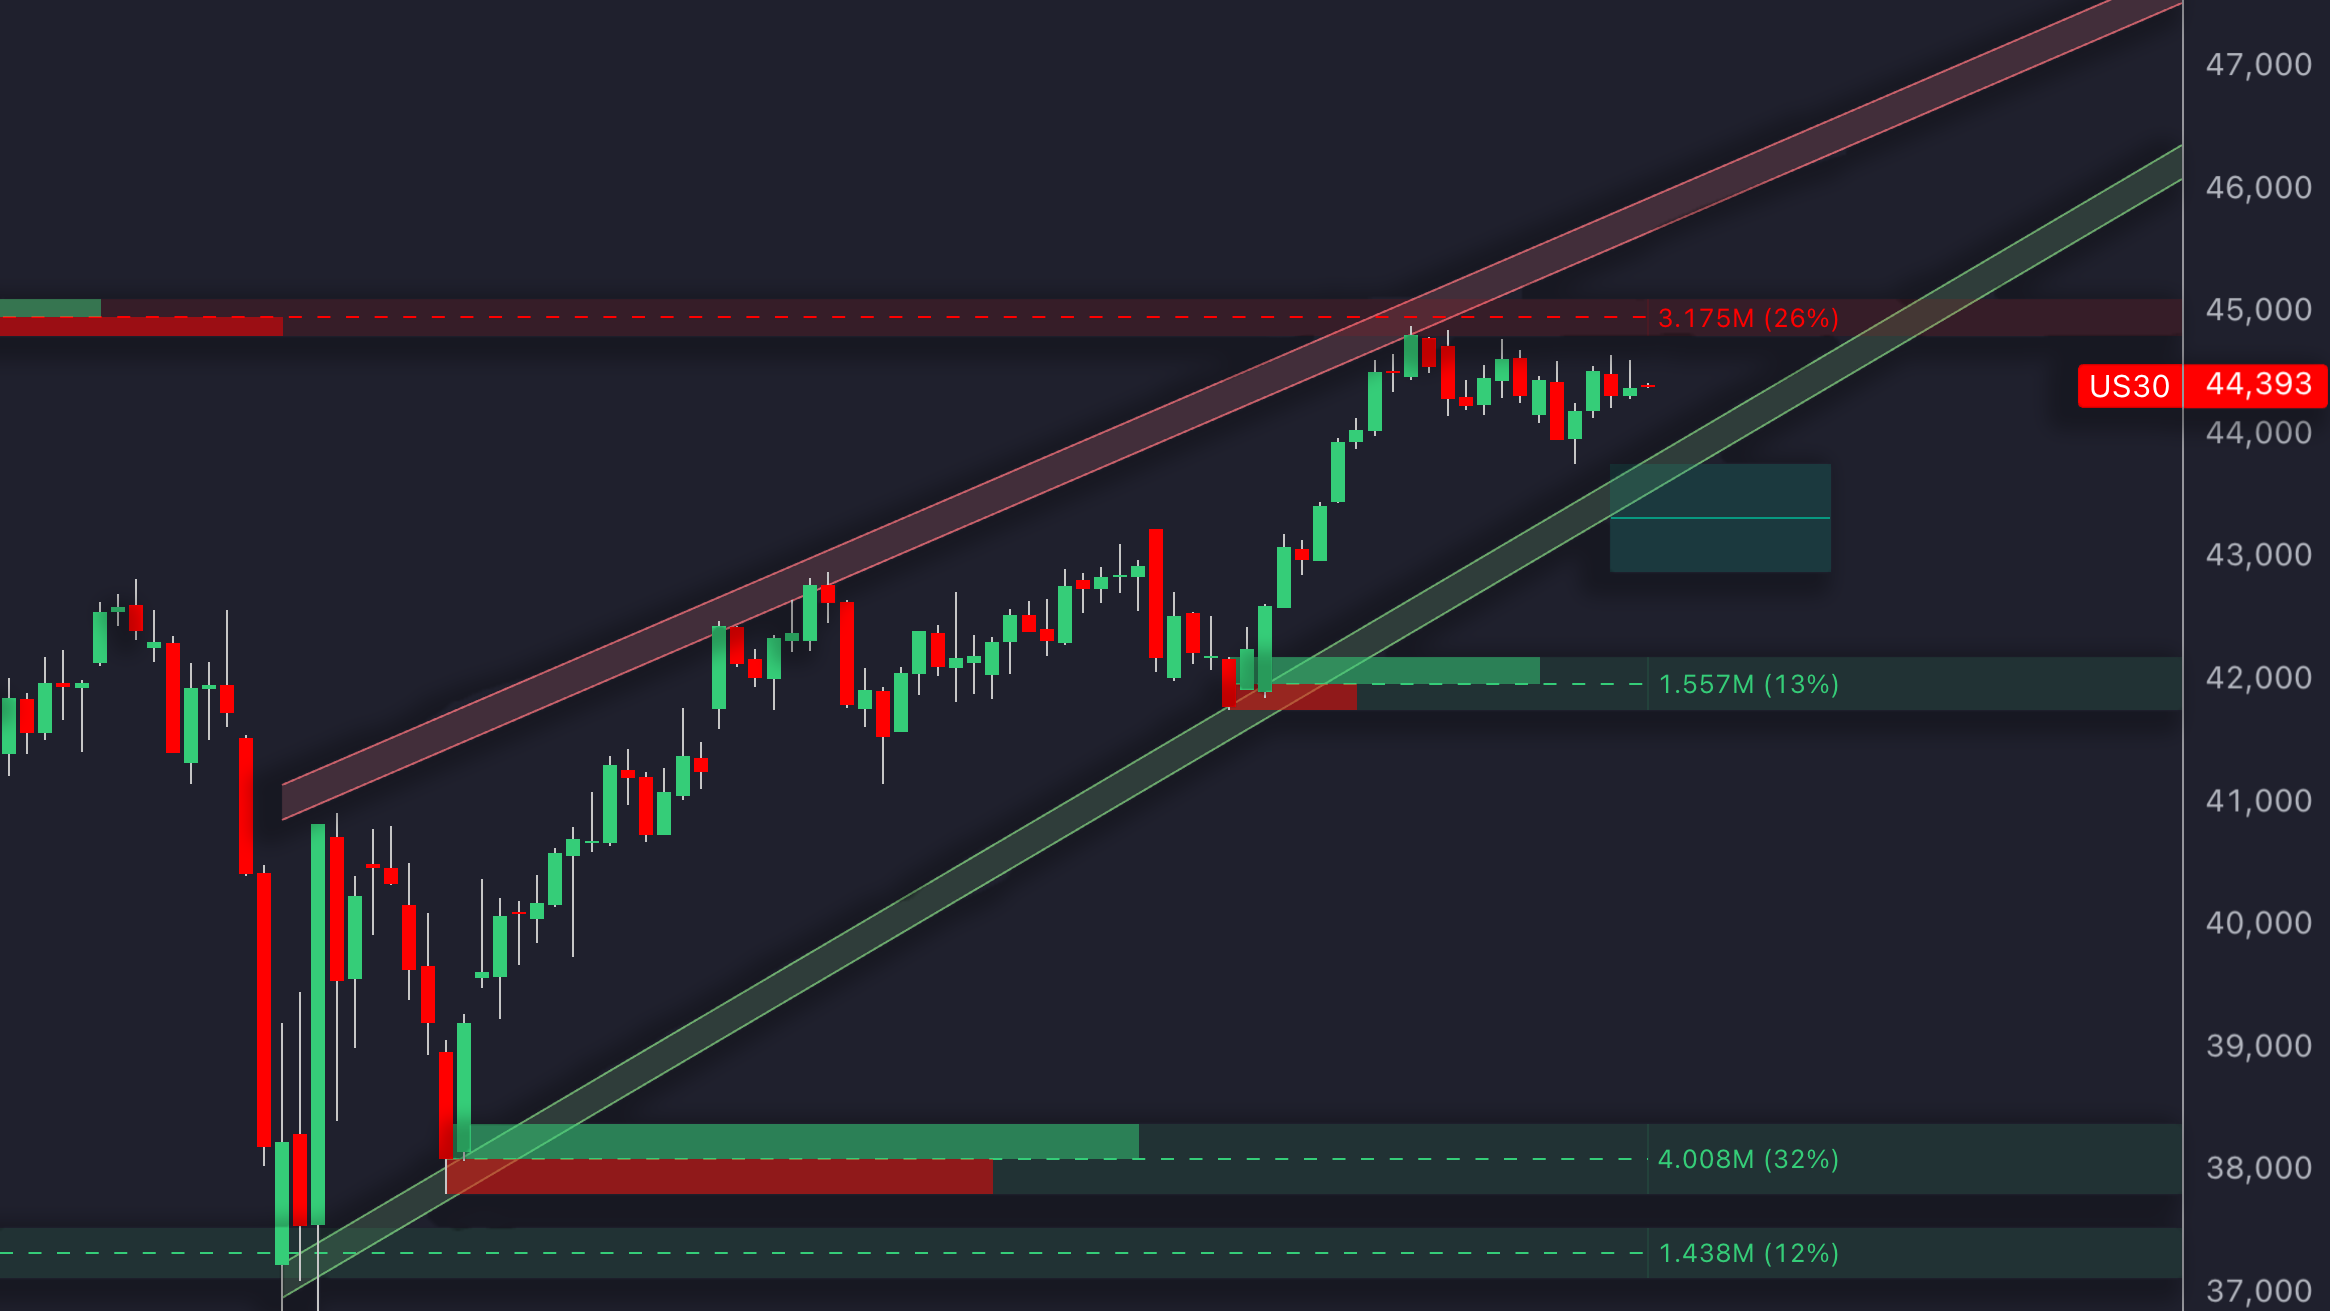
- What is Displacement? Sudden, strong price moves with Fair Value Gaps (FVGs), often driven by institutional traders.
- Institutional Sweeps: Large players target liquidity zones (e.g., previous highs/lows, round numbers, order blocks) to trigger stop-loss orders.
- Trading Insights: Spotting displacement aids in zone validation, entry timing, trend analysis, and risk management.
- Key Toolkits: Use candlestick patterns, RSI, moving averages, and LuxAlgo’s advanced indicator toolkits to confirm institutional activity.
- Kill Zones: Focus on high-volume periods, such as the London and New York sessions, for clearer patterns.
ICT Institutional Order Flow Simplified (Full Course)
Mechanics of Institutional Sweeps
Let’s dive into how institutional traders operate, focusing on the strategies they use to create displacement and capitalize on market inefficiencies.
Institutional entities, while far fewer in number than retail accounts, control the majority of traded volume—recent industry research puts their share at roughly 75 percent of global forex turnover.
Finding Liquidity Zones
A key focus of institutional traders is identifying areas where retail stop orders are likely to cluster. These areas, known as liquidity zones, often share distinct traits:
| Zone Type | Key Characteristics | Trading Significance |
|---|---|---|
| Previous Highs/Lows | Dense concentration of stop orders | Primary targets for sweeps |
| Round Numbers | Psychological price points | Frequent retail stop placements |
| Order Blocks | Zones of strong price rejection | Areas of institutional interest |
| Support/Resistance | Historical reaction levels | Stop order accumulation points |
Institutional traders analyze these zones on higher timeframes, where the significance of liquidity grows with the duration of the trend. Deep liquidity is essential for their strategies.
Stop Order Manipulation
One tactic used by institutions involves triggering clusters of stop-loss orders, creating volatility that benefits their positions. As George from TradePro Academy puts it:
Market makers often force price into a level where there is a cluster of stop orders by manipulating smaller retail traders into entering the market in the wrong direction.
To avoid falling victim to these stop hunts, traders might consider placing stops at less obvious levels or using wider stop-loss orders. These manipulations are especially prevalent during high-volume trading sessions, where institutional activity is easier to disguise.
Market Structure Changes
In addition to targeting liquidity zones and stop orders, institutional strategies often reveal themselves through shifts in market structure. Key elements to monitor include:
- Break of Structure Patterns
When a structure breaks but lacks follow-through, it could signal intentional inducement by institutions. - Volume and Order Flow
Sudden, high-volume moves often aim at clearing clustered orders at critical levels. - Price Action Confirmation
Rapid reversals near major swing points following sharp, decisive moves are a hallmark of institutional sweeps.
Technical Analysis Methods
Technical analysis plays a key role in spotting displacement events during institutional sweeps by using a combination of indicators.
Main Technical Indicators
Displacement trading relies on several essential technical tools, including:
| Indicator Type | Purpose | Key Signals |
|---|---|---|
| Candlestick Patterns | Detecting momentum | Large candle bodies with small wicks |
| Fair Value Gaps | Confirming displacement | Price gaps during consecutive moves |
| Moving Averages | Identifying trend direction | Price moving significantly from the average |
| Bollinger Bands | Measuring volatility | Price pushing beyond the bands |
| RSI (Relative Strength Index) | Confirming momentum shifts | Divergence between price and RSI trends |
LuxAlgo PAC Toolkit Analysis
The LuxAlgo PAC Toolkit builds on these core indicators to enhance the accuracy of displacement detection. It achieves this through:
- Volumetric Order Blocks: Highlights zones where orders are heavily concentrated, offering insights into potential price movements.
- Market Structure Analysis: Pinpoints breakout levels by examining price behavior and structure.
- Auto-Pattern Detection: Identifies price patterns that suggest institutional activity, such as sweeps or large-scale movements.
The PAC toolkit is particularly useful for identifying liquidity sweep zones, providing real-time alerts to help traders anticipate market shifts.
LuxAlgo OSC Toolkit Signals
To complement the PAC Toolkit, the LuxAlgo OSC Toolkit focuses on confirming displacement events by diving deeper into market dynamics:
- Divergence Detection: Tracks divergences between price movements and momentum indicators to uncover potential reversal points after institutional sweeps.
- Money Flow Analysis: Monitors institutional money flow in real time via the Volumetric Toolkit, identifying large orders and accumulation areas while confirming the strength of displacement events.
Trading Displacement Events
Displacement events call for a disciplined strategy to identify reversals and breakouts while maintaining strict risk control. Building on the concepts of liquidity zones and order manipulation, this section explains how to effectively trade these events.
Trading Market Reversals
When institutional traders drive prices through key levels, triggering clusters of pending orders, it often sets the stage for a potential reversal.
Confirm an entry after a price sweep when you notice:
- A bullish pin bar forming at a support level
- RSI indicating oversold conditions
- The presence of Fair Value Gaps (FVG)
- A noticeable spike in trading volume
For position sizing, consider:
- Risking 1–2 percent of your account per trade
- Factoring in the distance to your stop loss
- Allocating margin based on your overall strategy
Similarly, trading breakouts demands quick execution and a custom approach to managing risk.
Following Strong Breakouts
| Breakout Component | Entry Criteria | Risk Management Strategy |
|---|---|---|
| Volume Confirmation | Look for a surge in volume | Adjust stops based on market volatility |
| Price Action | Clear break of key structures | Place trailing stops near swing points |
| Momentum | Strong breakout impulse | Gradually scale out as momentum unfolds |
| Time of Day | Overlap of major sessions | Use smaller positions during quiet times |
Managing Trade Risk
As discussed earlier, liquidity zones play a critical role in determining stop-loss placement.
1. Stop Loss Placement
- For bullish setups, place stops just below the pre-shift low.
- For bearish setups, set stops above the pre-shift high.
- Aim for a minimum risk-to-reward ratio of 1:2.
2. Position Management
- Gradually add to positions as confirmation strengthens.
- Use trailing stops to lock in profits, placing them behind recent swing points.
- Take profits at liquidity zones or other significant price levels.
Keep a close watch on price movements near liquidity zones and adjust your positions as market structure shifts. LuxAlgo’s PAC Toolkit, which highlights volumetric order blocks, can help pinpoint reversal zones and refine stop-loss levels.
Summary
Displacement in Forex trading not only highlights institutional movements but also serves as a foundation for making informed trading decisions.
Main Points Review
In Forex spot markets, displacement reflects institutional activity through sharp price movements that breach key levels and create Fair Value Gaps. As discussed earlier, these events provide actionable signals for traders.
Key benefits of understanding displacement include:
- Spotting trading opportunities by observing momentum changes
- Confirming supply and demand zones
- Improving entry timing by aligning with institutional flows
- Minimizing false signals with multiple layers of confirmation
“Displacement helps the retail trader predict where likely institutional activity is and in what direction.” (Oreoluwa Fakolujo, HowToTrade.com)
Displacement patterns are particularly reliable during the London and New York Kill Zones, as institutional activity typically peaks during these sessions.
Using LuxAlgo Toolkits
LuxAlgo provides toolkits that enhance the precision of your trading strategies. The PAC Toolkit identifies significant order blocks and market shifts, while the OSC Toolkit focuses on detecting divergences and signaling trends. Together, these toolkits validate institutional activity through detailed order block analysis, momentum tracking, and trend confirmation.
To refine your trading approach:
- Keep an eye on Kill Zone trading periods
- Prioritize major currency pairs for more consistent patterns
- Use multiple indicators to confirm price movements
- Place stop-losses strategically beyond liquidity sweeps
“Smart Money forces price to trigger retail stops to generate liquidity.” (ACY Securities)
FAQs
How can retail traders avoid losses caused by institutional sweeps and displacement in the Forex market?
Retail traders can limit losses from institutional sweeps and sudden market shifts in the Forex market by gaining a solid understanding of liquidity zones and spotting areas where institutional moves are more likely. Key levels, such as major support and resistance zones, often act as magnets for institutional orders. Steering clear of placing trades directly in these zones can help traders avoid getting caught in sharp, unexpected price movements.
Incorporating technical indicators like moving averages, volume analysis, or price action patterns can also be a game-changer. These tools offer valuable insights into market momentum and potential reversals, helping traders make more informed decisions. On top of that, keeping an eye on major economic news and events is crucial, as these often trigger institutional activity and heightened market volatility.
By blending technical analysis with a keen awareness of market behavior, retail traders can navigate the Forex market more effectively and safeguard their positions against sudden disruptions.
What are Fair Value Gaps (FVGs) and how do they reveal institutional activity in Forex trading?
Fair Value Gaps (FVGs) refer to price imbalances that emerge when the market experiences rapid movement, typically fueled by aggressive buying or selling—often linked to institutional traders. These gaps occur when price action skips over certain levels, leaving behind areas where trades weren’t fully executed.
What makes FVGs particularly noteworthy is their ability to reveal supply-demand imbalances and pinpoint zones of concentrated institutional activity. Markets often retrace to “fill” these gaps, creating potential entry or exit points.
How do the LuxAlgo PAC and OSC Toolkits help identify and analyze displacement events in Forex trading?
The LuxAlgo PAC and OSC Toolkits make it simpler to identify and analyze displacement events in Forex trading by focusing on key market dynamics:
- The PAC Toolkit automatically pinpoints support and resistance levels, allowing traders to spot displacement patterns and areas where institutional activity might be occurring.
- The OSC Toolkit relies on oscillator-based indicators to confirm momentum shifts, which are often tied to displacement events.
By combining these toolkits, traders gain actionable insights, enabling them to navigate significant market movements with more confidence and accuracy.
References
- Inversion Fair Value Gaps (IFVG) – LuxAlgo
- Liquidity Zones Documentation – LuxAlgo
- Candlestick Structure Indicator – LuxAlgo
- Understanding Moving Averages – LuxAlgo Blog
- Indicator Overlay Documentation – LuxAlgo
- Order Blocks Documentation – LuxAlgo
- Liquidity Sweeps Indicator – LuxAlgo
- Real-Time Alerts Documentation – LuxAlgo
- Volumetric Toolkit – LuxAlgo
- Fibonacci Trailing Stop – LuxAlgo
- Imbalances Documentation – LuxAlgo
- AI Backtesting Assistant – Fetching Strategies
- Dynamic Order Blocks Indicator – LuxAlgo
- Session Sweeps Indicator – LuxAlgo
- Support-Resistance Dynamic Indicator – LuxAlgo
- TradePro Academy
- ICT Institutional Order Flow Video
- LuxAlgo OSC Toolkit Video
- ACY Securities
- HowToTrade.com


