
Learn how to identify and trade the double bottom spring pattern for bullish reversals, enhancing your trading strategy with key insights.
The double bottom spring pattern is a bullish reversal chart setup that signals a potential price increase. This pattern is shaped like a "W" and occurs when a security's price forms two similar lows, separated by a peak (neckline). Here's what you need to know:
Key Takeaways
- Success Rate: 88% in bull markets.
- Profit Potential: Average gains of +50% after breakout.
- Core Elements:
- Two Bottoms: Price tests the same support level twice.
- Neckline: The peak between the two lows, breakout above this confirms the pattern.
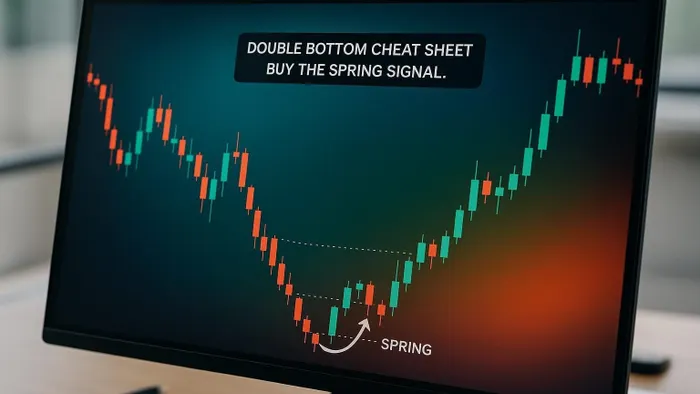
- Spring Signal: A brief dip below support followed by a quick rebound.
Why It Works
- Support Confirmation: Repeated tests of the same level show strong buying interest.
- Volume Behavior: Higher volume during rebounds and breakouts validates the pattern.
- Risk Management: Stop-loss can be set below the second bottom for controlled risk.
How to Trade It
- Identify the Pattern: Look for two similar lows and a neckline.
- Confirm the Spring Signal: Watch for a quick dip below support with a fast recovery.
- Enter the Trade: Buy after a breakout above the neckline.
- Set Stop-Loss: Place it just below the second bottom.
- Target Price: Measure the pattern's height and aim for gains of 10-20% or more.
This pattern is most reliable in bullish markets and can be paired with tools like LuxAlgo's PAC toolkit for automated pattern detection and alerts.
Pro Tip: Avoid trading this pattern in strong downtrends or during market consolidation, as false signals are more likely.
Double Bottom Pattern Basics
Core Pattern Elements
A double bottom pattern is a bullish reversal setup that signals a potential shift in market direction. It features two distinct price lows near the same support level, separated by a peak known as the neckline. Here’s a breakdown of its main components:
| Component | Description | Why It Matters |
|---|---|---|
| First Bottom | The initial low during a downtrend | Establishes the key support level |
| Recovery Rally | A price bounce from the first low (10-20%) | Shows early signs of buying interest |
| Neckline | The peak between the two bottoms | Acts as the breakout confirmation level |
| Second Bottom | A retest of the support level | Strengthens the support's reliability |
| Breakout | Price move above the neckline | Confirms the pattern and signals reversal |
Volume behavior is crucial here. It often increases at the lows and surges during the breakout, reinforcing the validity of the reversal signal. These elements play a key role in shaping trading strategies.
Pattern Impact on Trading
The double bottom pattern is a valuable tool for traders, indicating a likely transition from a downtrend to an uptrend. When identified correctly, it allows traders to set price targets based on the pattern’s height, usually 10-20%, with potential gains extending up to twice that distance.
Here’s how this pattern benefits trading strategies:
- Confirms Support: Repeated tests of the same level verify strong support.
- Defines Risk: Traders can set stop-loss orders just below the second bottom for controlled risk.
- Offers Clear Targets: Price targets are measurable, based on the pattern’s height.
For added accuracy, traders often combine the double bottom with other indicators. For example, spotting a bullish divergence on the Relative Strength Index (RSI) can help separate genuine reversals from false signals. Up next, we’ll explore the spring signal, a key confirmation tool for this pattern in action.
Spring Signal Analysis
Spring Signal Definition
A spring signal happens during a double bottom when prices briefly dip below a key support level before quickly bouncing back. This false breakout often traps bearish traders, creating an opportunity for bullish traders to capitalize on the price rebound.
"A spring is a market phenomenon that occurs when prices briefly dip below a critical support level before swiftly rebounding back above it." - Kyle Janas, Opinicus
Spring Signal Requirements
For a spring signal to hold up, several conditions must be met:
| Requirement | Description | Confirmation Method |
|---|---|---|
| Price Action | Prices dip below support but recover quickly | Observe real-time price movement |
| Volume Profile | Lower volume during the dip compared to the initial support test | Check volume indicators |
| Trend Context | A prior downtrend showing signs of slowing down | Look for stopping volume or selling climax |
| Follow-through | Prices rebound above support shortly after the dip | Watch the post-dip price action |
These conditions become more reliable when paired with the broader market context. For example, high-volume springs often need follow-up tests, showing lower volume as prices move higher. While understanding these factors is crucial, traders should also be aware of potential missteps that can weaken the signal.
Spring Signal Pitfalls
Even when the technical setup looks promising, certain mistakes can turn a spring signal into an expensive miscalculation:
- Failed Recovery: If prices fail to rally and instead hover near the support level, the spring signal is likely invalid.
- Trend Violation: Attempting a spring in a strong downtrend is risky. Wait for clear signs of trend exhaustion before acting.
- Volume Inconsistency: If the recovery volume is higher than the volume during the dip, it could indicate a breakout rather than a spring signal.
"Springs and upthrusts are not mere technical patterns but powerful signals that capitalize on traders' emotions and misconceptions." - Kyle Janas, Opinicus
Trading Guide: Double Bottom Spring
Spring Signal Checklist
Follow these steps to confirm the pattern and identify a reliable spring signal:
- Pattern Validation
Before making a trade, check for these key features:- Two distinct bottoms within a 4% to 10% price range.
- A peak between the bottoms that's at least 10% higher than the second bottom.
- The pattern should form over several weeks to months on daily charts.
- Spring Signal Confirmation
Once the pattern is verified, look for these signs:- A quick dip below support that rebounds immediately.
- Higher trading volume during the rebound.
- A strong breakout above the neckline.
Once these conditions are met, you’re ready to set up your trade.
Trade Setup Guidelines
Here’s how to structure your trade after confirming the pattern and spring signal:
| Component | Guideline | Rationale |
|---|---|---|
| Entry Point | Buy above the neckline breakout | Confirms the pattern has completed |
| Stop Loss | Place just below the second bottom | Protects against a failed breakout |
| Primary Target | Measure the pattern height from the neckline | Reflects the anticipated price movement |
| Risk/Reward | Aim for at least a 1:2 ratio | Ensures a favorable risk-to-reward balance |
LuxAlgo PAC Toolkit Guide

The Price Action Concepts (PAC) toolkit can simplify trading the double bottom spring pattern. Here's how to use it effectively:
- Pattern Detection Setup
- Activate the PAC toolkit on your chart.
- Adjust the double bottom detection settings.
- Set alerts for specific volume thresholds.
- Alert Configuration
- Create alerts for possible spring formations.
- Use volume-based triggers.
- Enable notifications for neckline breakouts.
- Position Management
- Leverage the built-in position sizing calculator.
- Keep an eye on the pattern quality scores.
- Track the live development of the pattern.
How to Trade the Double Bottom Pattern CORRECTLY (Chart …
Strategy Assessment
The double bottom spring strategy is designed to spot market reversals. Understanding both its advantages and limitations is key to using it effectively.
Benefits vs. Drawbacks
| Aspect | Benefits | Drawbacks |
|---|---|---|
| Reliability | 88% success rate in bull markets Average profit potential of +50% after breakout |
Less effective during market consolidation |
| Pattern Recognition | Clear visual structure Easily identifiable support levels |
Subjective neckline identification Bottoms may not align perfectly |
| Time Horizon | Best suited for daily/weekly charts Allows ample time for trade preparation |
Pattern formation can take weeks or months |
| Risk Management | Defined stop-loss points Clear invalidation levels |
False breakouts can lead to losses Risk-reward ratio may not always be favorable |
| Volume Analysis | Volume confirmation strengthens signals Validates breakouts |
Volume indicators can be misleading Not always reliable |
This breakdown highlights the strategy's strengths and challenges, offering a clearer picture of when and how it works best.
The strategy shines in bull markets. Barry D. Moore CFTe emphasized its reliability, stating:
"The double-bottom chart pattern is one of the most reliable and accurate chart indicators in technical analysis"
Key Takeaways
Strengths:
- The pattern's clear structure provides defined entry and exit points.
- Volume confirmation enhances the reliability of breakout signals.
Risks:
"As with any chart pattern, it is possible for false breakouts to occur, leaving traders with a loss"
- Its contrarian nature requires precise timing and disciplined execution.
- The extended time needed for pattern formation can challenge a trader's patience.
For optimal results, combine this strategy with additional indicators and enforce strict risk management practices to capitalize on its high success rate during bullish trends.
LuxAlgo Toolkits Application
Building on the PAC tools mentioned earlier, LuxAlgo introduces advanced functionalities to support well-tested, market-specific strategies. This section focuses on how these toolkits enhance double bottom spring trading, offering automated pattern detection and strategy validation.
LuxAlgo's toolkits streamline double bottom spring trading by automating key processes like pattern recognition and backtesting, ensuring accurate signal analysis.
Pattern Detection System
The Price Action Concepts (PAC) toolkit automates the identification of double bottom patterns and spring signals using detailed market structure analysis. Its standout features include:
- Real-time detection of market-structure elements
- Order block and imbalance identification to confirm signals
- Custom alerts for spring signal notifications
This toolkit combines multiple technical factors, such as volume, price action, and market structure, to provide more reliable validation of potential spring signals.
Strategy Testing Tools
LuxAlgo’s backtesting features allow traders to test their double bottom spring strategies before going live. Two main backtesters are available:
| Feature | PAC Backtester | OSC Backtester |
|---|---|---|
| Focus Area | Price action patterns | Oscillator-based signals |
| Key Capabilities | Market-structure analysis Order-block detection Spring-signal validation |
Divergence detection Money-flow analysis Trend confirmation |
| Entry Conditions | Custom spring-signal rules | Oscillator-based confirmations |
| Alert System | Position entry/exit notifications | Real-time signal alerts |
The “Step & Match” algorithm lets traders define entry rules tailored to specific spring-signal conditions, ensuring precision in strategy execution.
U.S. Market Settings
LuxAlgo includes features specifically designed for U.S. market trading:
- Pre-set volume analysis tailored to NYSE and NASDAQ sessions
- Time filters aligned with U.S. market hours (9:30 AM-4:00 PM ET)
- Price formatting in USD with standard decimal notation
- Date/time displays in U.S. format (MM/DD/YYYY)
The platform also automatically adjusts for market holidays and session variations, ensuring consistent signal generation and analysis.
Summary
The double bottom spring pattern indicates potential bullish reversals in U.S. markets. This pattern is identified by two similar lows (within a 3-4% variance), offering opportunities for strategic entry. Here's how to effectively use this pattern:
- Pattern Recognition: Look for two matching lows separated by a confirming peak.
- Volume Confirmation: A breakout accompanied by a volume surge strengthens the signal.
- Risk Management: Place a stop-loss just below the second bottom and aim for a profit target equal to the pattern's height.
To enhance your trading approach, LuxAlgo's PAC toolkit offers these features:
| Component | Trading Application |
|---|---|
| Real-time Detection | Tracks pattern formation during U.S. market hours |
| Volume Analysis | Analyzes NYSE/NASDAQ trading volumes |
| Signal Validation | Confirms patterns within the market structure |
| Position Management | Provides entry/exit alerts with USD-based pricing |
This summary highlights the key aspects of the strategy and the toolkits available to improve trading decisions in U.S. markets.
FAQs
What should I look for to confirm a 'spring' signal in a double bottom pattern?
To confirm a spring signal in a double bottom chart pattern, focus on these key indicators:
- Price Break Below Support: Look for the price to briefly dip below the support level formed by the two bottoms, creating a false breakout.
- Strong Reversal Candle: A bullish reversal candle (e.g., a hammer or engulfing pattern) near the false breakout suggests a potential spring.
- Increased Volume: A noticeable surge in trading volume during the reversal adds credibility to the signal.
These signs, when combined, can help validate the spring signal and identify a potential bullish reversal opportunity. Always remember to confirm with additional technical analysis tools or strategies for stronger confidence in your trade.
How can traders manage risk effectively when trading the double bottom spring pattern in a volatile market?
To manage risk effectively when trading the double bottom spring pattern in volatile markets, traders should prioritize a few key strategies. First, set a stop-loss order just below the second bottom of the pattern to limit potential losses if the trade moves against you. This helps protect your capital in case the pattern fails.
Next, wait for a confirmed breakout above the neckline (the resistance level between the two bottoms) before entering a trade. This confirmation increases the likelihood of a sustained bullish move. Additionally, monitoring volume levels during the breakout can provide extra validation, higher volume often indicates stronger buying pressure.
By combining these techniques with sound risk management practices, traders can improve their chances of success while minimizing potential losses in unpredictable market conditions.
What are some additional tools or indicators that can improve trading accuracy when using the double bottom spring pattern?
To enhance trading accuracy with the double bottom spring pattern, consider incorporating additional tools and indicators to confirm signals and refine entry points. For example:
- Volume Analysis: A spike in trading volume during the spring can validate the pattern and indicate strong buyer interest.
- Moving Averages: Use a short-term moving average (e.g., 20-day) to identify the trend direction and confirm bullish reversals.
- RSI (Relative Strength Index): Look for oversold conditions or bullish divergences to support the likelihood of a reversal.
These tools can provide extra layers of confirmation, helping you make more confident and informed trading decisions.