Volume Analysis Techniques to Confirm Setups
Volume analysis helps evaluate the activity around a trading setup; confirmation means that a defined condition has been met, not that the trade is certain to work. A breakout can fail on high volume, and a trend can continue on quieter activity. Read volume together with price, session context, and a specific risk rule.
Use LuxAlgo’s native charts to examine the setup and Quant to help turn your idea into a strategy you can review and test. Begin with the price-only rule, then measure what changes when you add a volume condition.
Volume Analysis Methods and Their Limits
Compare Current, Average, and Relative Volume
Current volume is the quantity reported for a particular bar or period. Average volume is the mean of the volumes in a specified sample. Relative Volume (RVOL) expresses current volume as a ratio to a chosen historical baseline:
RVOL = current volume ÷ comparison average.
For example, if the preceding 20 completed sessions averaged 1 million shares and the current completed session traded 1.5 million, RVOL is 1.5. That is 150% of average, or a 50% increase. Average volume is not the total of all shares traded across the sample; that total must be divided by the number of observations.
A threshold such as 1.5× or 2× average can be a rule to test. It does not universally classify market conviction, breakout quality, or reversal probability. Record whether the current bar is excluded from the average and how zero or missing volume is handled.
Match the Comparison to the Session
Intraday activity varies across the session. Comparing an unfinished morning with full historical days can make activity look artificially low. Relative Volume at Time compares regular or accumulated volume at corresponding historical offsets; unfinished bars still need care.
Check the symbol, venue, session, time zone, and volume units. Shares, contracts, crypto quantities, and broker tick activity are different inputs. Missing data is not evidence that nobody traded.
Read Volume Trends Alongside Price
| Observation | What it describes | Next question |
|---|---|---|
| Price rises with increasing volume | More activity accompanied the advance | Does the entry rule hold, and what would invalidate it? |
| Price falls with increasing volume | More activity accompanied the decline | Is price continuing lower or rejecting the low? |
| Price rises while volume fades | The advance has less reported activity against the chosen comparison | Is this normal session behavior or a meaningful change for this setup? |
| A volume spike follows an extended move | Activity increased near the latest price extreme | Does price show continuation, rejection, or consolidation? |
Do not label every high-volume up bar accumulation or every high-volume down bar distribution. Quantity alone does not reveal who traded, whether positions were opened or closed, or what participants intend to do next.
Use Volume Profile for Price-Level Context
Volume Profile distributes activity across price bins. High Volume Nodes mark concentrations and Low Volume Nodes mark valleys in the selected history. A “volume shelf” is an informal description of a broader region of activity, so define the range you mean before using it in a rule.
An LVN or low-volume region is not the same as a gap in the price chart or missing feed data. Nor does it show the current depth of resting orders. Historical nodes are reference zones, not barriers that price must respect.

LuxAlgo’s native profiles include Session, Rolling, and Visible Range. Session and Rolling require supported footprint data. Visible Range uses candle volume and changes as you pan or zoom; its directional colors do not identify trade aggressors. Verify data coverage and keep the settings fixed when comparing examples.
Evaluate Breakouts and Reversals Separately
Breakout Confirmation Is a Price-and-Volume Rule
Mark resistance or support before the breakout. Specify whether entry needs a completed close beyond the level, a retest, or another observable event. Then define the volume condition over the same decision period.
A failed breakout is defined by price behavior under your rule—for example, reclaiming the broken level or hitting the invalidation stop—not by volume being below 50% of average. High-volume breakouts can fail too. Likewise, follow-through does not automatically require volume above a universal 20-day threshold.
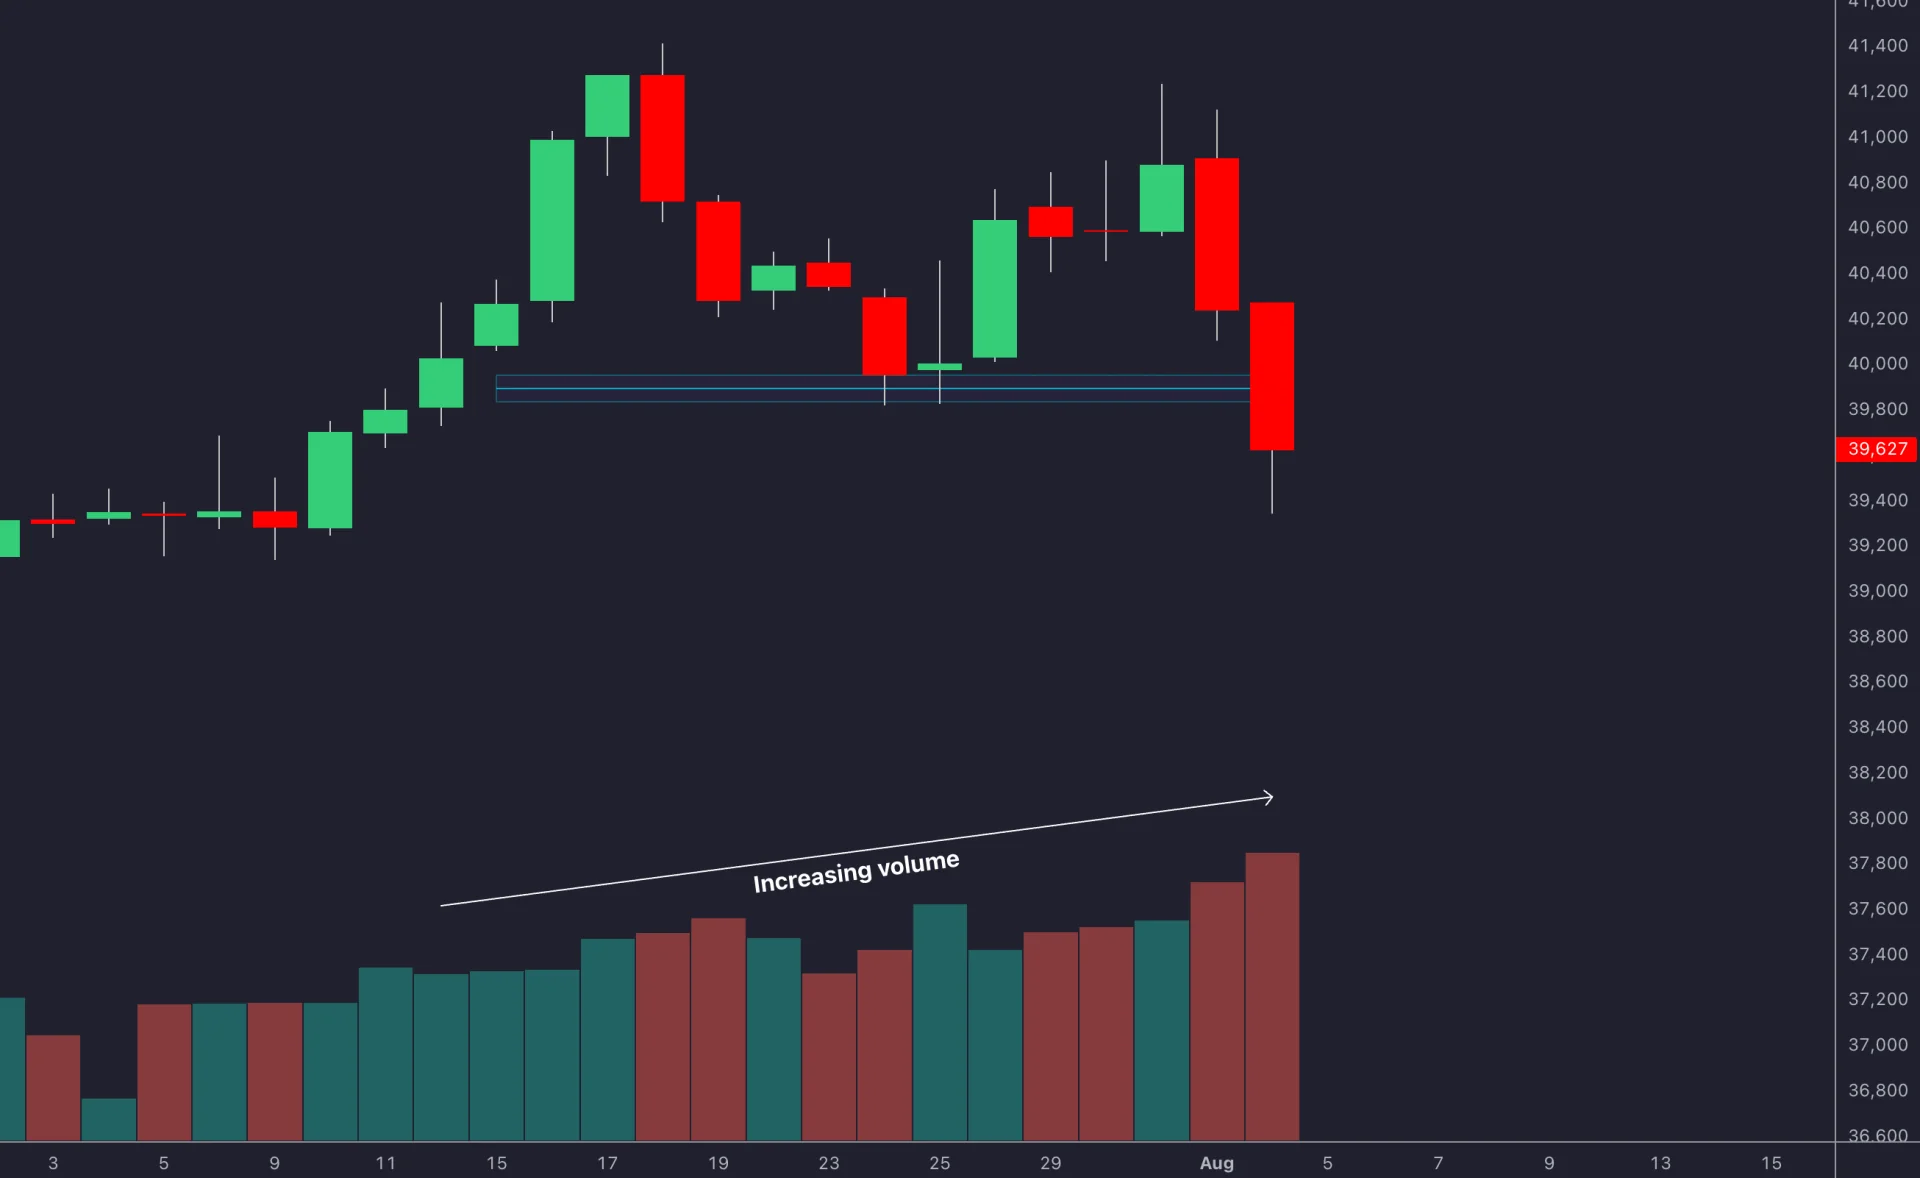
Suppose a hypothetical stock closes above premarked resistance while trading 1.5 times its comparison average. Record the breakout, the baseline, and what happens after the specified entry. A later rally does not prove that volume caused it; include failed examples when evaluating the filter.
Reversal Signals Need a Defined Trigger
A spike after an advance may be consistent with exhaustion, but it may also accompany further gains. Rising volume during a decline can accompany continuation or a sharp rejection of lower prices. Wait for the price condition your strategy requires.
When using a volume-derived indicator, compare corresponding swings. Regular bullish divergence is a lower price low with a higher indicator low; regular bearish divergence is a higher price high with a lower indicator high. Raw volume fading during an advance is a broader participation observation, not necessarily the same signal.
For OBV, a bar’s full volume is added or subtracted according to its close relative to the prior close. That calculation differs from CVD or a rolling flow measure. Respect pivot-confirmation delays and do not use later bars to justify earlier entries.
Create Volume Trading Rules in LuxAlgo
- Choose the market and data. Specify the venue, session, interval, volume units, and historical coverage.
- Define the setup. Identify the level, pattern, or trend condition using information available at the time.
- Choose one volume filter. Give it an explicit formula, lookback, threshold, and timing.
- Set exits and sizing. Define invalidation, targets or other exits, and the risk budget.
- Review the implementation. Ask Quant to implement the rule, then inspect the code and sample trades. Confirm access to the required data instead of assuming every visual chart feature is available to a strategy.
- Compare the results. Test the same price-only strategy with and without the filter, including costs and a later validation period.
Use native strategy properties and results to account for commission and slippage and inspect drawdown and individual trades. If the implementation approximates a requested indicator, identify the difference before treating its results as equivalent.
Adapt the Test to Your Trading Horizon
Scalping, day trading, and swing trading need different timing and cost assumptions. A short interval emphasizes intraday changes, while a broader window provides more historical context. Neither requires a universal chart interval, and a final daily or weekly profile was not available earlier in that period.
Set alerts only for conditions the chosen tool actually supports. A generic price alert is not automatically an alert for an evolving volume node, and a notification does not itself execute a broker order.
Use Liquidity and Risk Checks Beyond Share Volume
A fixed threshold such as 500,000 shares per day cannot guarantee easy execution. Price, dollar turnover, spread, available depth, volatility, and your order size all matter. Consider company news and fundamentals where relevant, but test their role explicitly instead of attributing every price move to volume.
For a hypothetical share trade at $40 with a $38.50 stop, a $150 risk budget, and $0.10 per-share execution-cost allowance, size is floor($150 ÷ $1.60) = 93 shares. Planned risk is $148.80. Gaps and unexpected slippage can make the actual loss larger.
Different instruments require their contract or point value. Follow position-sizing principles and consider existing exposure; a large volume spike does not justify ignoring the risk budget.
Video: A Beginner’s Guide to Volume-Price Analysis
This TC Trading tutorial introduces volume-price analysis. Its examples are educational; use consistent definitions and test your own rules before relying on a setup.
Review What the Volume Filter Actually Adds
Keep a record of eligible setups, rejected signals, losing trades, and successful examples. Compare net performance, drawdown, and trade frequency rather than judging the method by a few attractive charts.
Native charts and Quant provide a workflow for this review. A momentum tool’s reversal condition is not automatically a raw-volume signal or an identical strategy input, so keep those definitions distinct when combining tools.
Continue with volume indicators compared and spikes, profiles, and divergence techniques for more detailed explanations.
FAQs
How can traders use volume analysis to identify potential market reversals, and what key patterns should they watch for?
Watch for unusual activity near a price extreme and mismatches between price and a defined volume measure. Neither guarantees a reversal. Require the specified price trigger, respect signal-confirmation timing, and define invalidation and risk before entering.
How does relative volume (RVOL) help confirm breakout strength, and how is it different from analyzing average volume?
Average volume is the mean volume in a chosen historical sample. RVOL divides current volume by that baseline, showing how unusual activity is. An RVOL above 1 means above-average activity under that comparison, not a guaranteed successful breakout. Match sessions and account for unfinished periods.
How can traders use volume analysis alongside technical indicators to improve their trading strategies?
Assign each tool a purpose, such as a moving-average trend filter or a defined OBV comparison. Test the same price strategy with and without the added condition, including costs and later validation data. Several related indicators do not provide independent confirmation.
Read next