

Explore an effective three-filter strategy for identifying high-quality investments by analyzing financial strength, growth potential, and valuation metrics.
Terry Smith’s three-filter strategy helps you identify strong investments by focusing on financial health, growth potential, and valuation. The approach is simple yet effective:
-
Financial Strength:
- Return on Capital Employed (ROCE): Over 15 % (5-year average)
- Debt-to-Equity Ratio: Low to moderate
- Interest Coverage Ratio: Above 10 x
-
Growth Metrics:
- Earnings Per Share (EPS) Growth: Over 7 % (10-year CAGR)
- Free Cash Flow (FCF) Growth: Over 5 % (5-year CAGR)
- Sales Growth: Over 10 % annually
-
Multi-Factor Scoring:
- Combines quality, value, and growth metrics for a balanced 0-100 score.
Quick Tip:
Stick to companies with strong fundamentals, consistent growth, and manageable risks. Use tools like PEG ratios and sector comparisons to ensure you're not overpaying for growth.
This structured method ensures you focus on data-driven decisions and avoid emotional investing. Ready to dive deeper? Let’s break it down step by step.
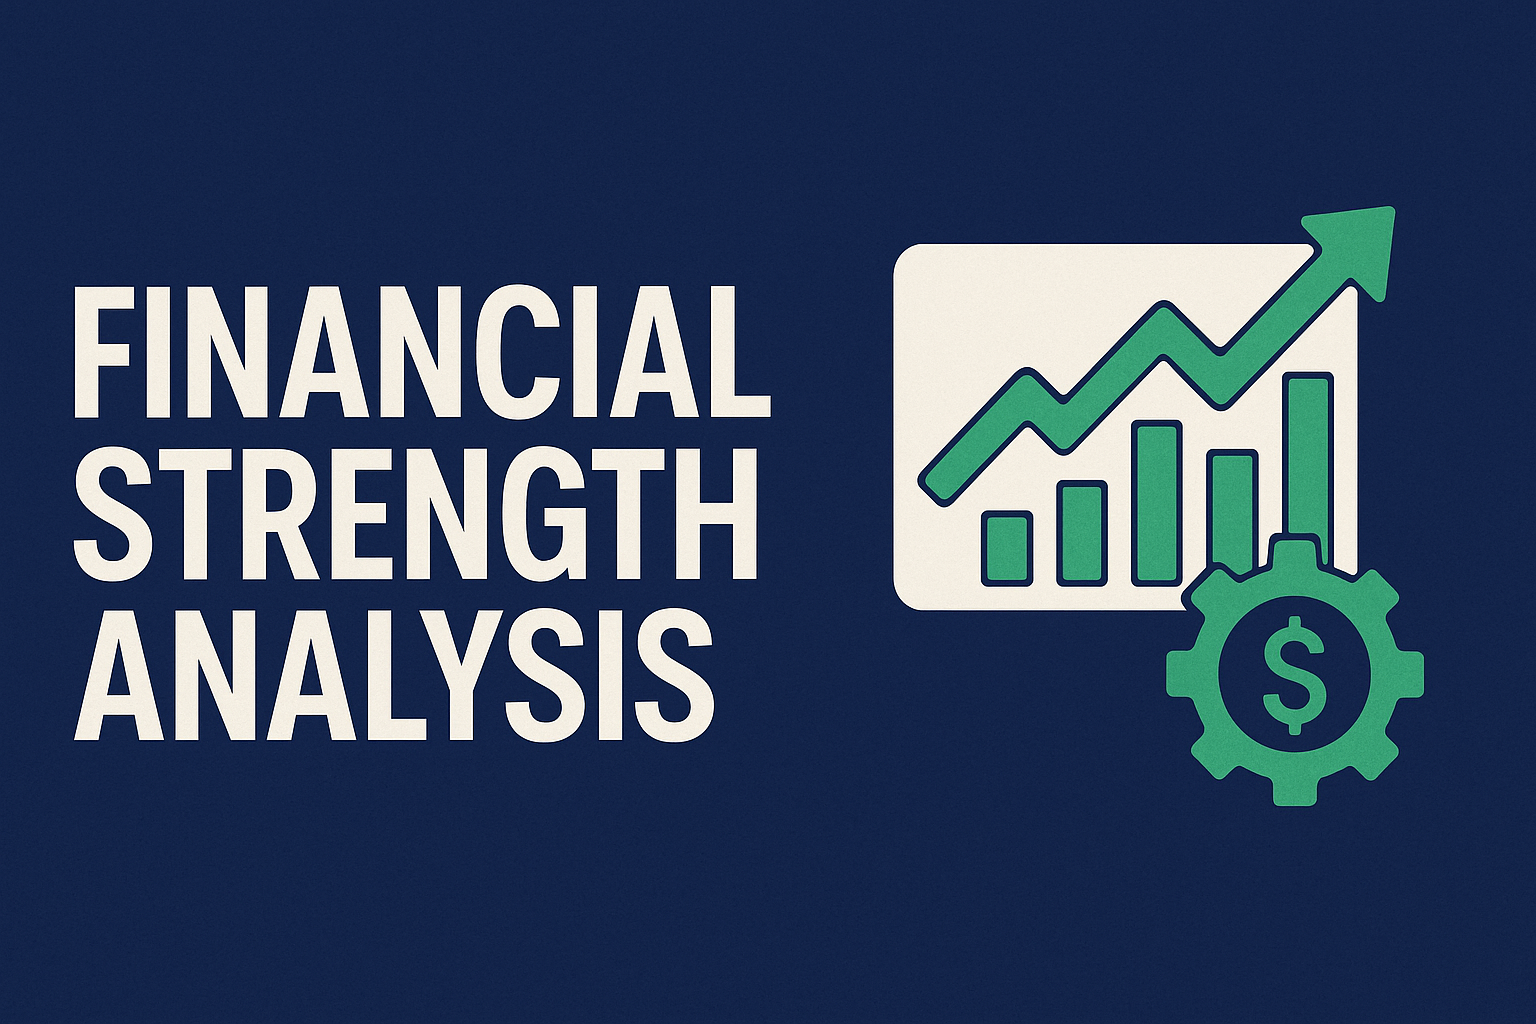
1. Financial Strength Analysis
Core Financial Metrics
Analyzing financial strength is key to spotting top-notch investments. The focus here is on profitability, efficiency, and stability – essential metrics that set the stage for further evaluation:
| Metric | Target Threshold | Why It Matters |
|---|---|---|
| Return on Equity (ROE) | Above industry average | Gauges how well management uses shareholder funds to generate profit |
| Return on Capital Employed (ROCE) | Higher than industry norms | Reflects how efficiently a company uses its capital |
| Interest Coverage Ratio | Above 2 x | Measures the ability to meet debt payments comfortably |
| Debt-to-Equity Ratio | Low to moderate | Highlights the level of financial risk and leverage |
| Current Ratio | Above 1.0 | Indicates the company's ability to cover short-term obligations |
"Stock analysis is both art and science." – Kritesh Abhishek
Why Financial Strength Matters
Companies with strong financial metrics offer clear advantages:
- Economic Stability: Solid financials act as a buffer during economic downturns, helping maintain profitability.
- Flexibility for Growth: A healthy balance sheet supports new investments and ensures smooth operations.
- Lower Risk Exposure: Better debt management and interest coverage reduce the likelihood of financial distress.
"It's far better to buy a wonderful company at a fair price than a fair company at a wonderful price." – Warren Buffett, CEO of Berkshire Hathaway
For investors, strong financial health means more than just numbers. For example, the Quick Ratio – which excludes inventories – provides a sharper view of a company’s short-term liquidity. This ensures you're evaluating businesses with genuinely strong financial footing, not just those with assets tied up in less liquid forms like inventory.
2. Growth and Value Assessment
Key Growth Indicators
To gauge a company's growth potential, focus on measurable metrics that reflect consistent performance. Here are some key indicators:
| Growth Metric | Target Range | Importance |
|---|---|---|
| Sales Growth | Over 10 % annually | Shows steady market demand |
| Operating Margin | Increasing YoY | Highlights pricing power and efficiency |
| Free Cash Flow | Positive and growing | Ensures flexibility for reinvestment |
| Earnings Growth | Accelerating YoY | Signals improving profitability |
| Return on Equity | Above industry avg. | Demonstrates effective capital use |
These metrics provide a snapshot of a company's ability to maintain demand and operate efficiently, even in challenging market conditions.
Price vs. Value Metrics
The PEG ratio is a useful tool for comparing a company's price-to-earnings (P/E) ratio with its earnings growth. A PEG ratio below 1.0 can indicate that a stock might be undervalued in relation to its growth potential. Other important valuation factors include:
- Net Profit Margins: Comparing these to industry averages helps you understand a company's pricing power and operational efficiency.
- Price Momentum: Confirms whether the fundamental metrics are aligned with market trends.
By combining these metrics, you can conduct a more thorough analysis to determine the quality of an investment.
Common Investment Mistakes
One major mistake is relying on intuition or stories instead of data. Stick to a systematic evaluation process with clear performance-based exit criteria to avoid unnecessary losses.
"The proof is in the numbers and a careful study and analysis of the numbers can help us find stocks with growth potential and big gains in the future while avoiding stories and nonsense."
Next, we'll explore how to integrate these metrics into a multi-factor scoring system.
3. Multi-Factor Scoring Method
Score Calculation Steps
This method combines quality, value, and growth metrics into a scoring system that assigns a 0-100 score to each stock. Here's how it works:
| Factor Category | Weight Range | Key Metrics |
|---|---|---|
| Quality Score | 30-40 % | Financial strength, ROE, operating margins |
| Value Score | 30-40 % | P/E ratio, PEG ratio, Price/Book |
| Growth Score | 20-40 % | Revenue growth, EPS growth, FCF growth |
To determine the final score:
- Normalize each metric to a 0-100 scale using peer-group data.
- Multiply each normalized metric by its assigned weight.
- Add up the weighted scores to get the final composite rating.
Weight Adjustment Guide
Factor weights can be adjusted depending on market trends and investment priorities. For example, during uncertain economic times, emphasizing quality metrics can highlight financially stable companies. On the other hand, a focus on growth metrics might suit a more aggressive investment strategy.
| Market Condition | Quality Weight | Value Weight | Growth Weight |
|---|---|---|---|
| High Volatility | 40 % | 40 % | 20 % |
| Stable Growth | 30 % | 35 % | 35 % |
| Recovery Phase | 30 % | 30 % | 40 % |
Benefits of the Multi-Factor Method
This approach offers several benefits for investors:
- Reduces concentration risk by using diverse selection criteria.
- Accounts for different return drivers across various market cycles.
- Limits the influence of outliers in individual metrics.
- Highlights companies with balanced performance across all factors, rather than excelling in just one area.
With consistent scoring and adjustable weights, this method allows investors to respond to changing market conditions while maintaining a disciplined investment strategy. The scores provide a clear guide for selecting stocks and building a well-rounded portfolio.
Portfolio Construction Steps
Stock Selection Process
To start, identify strong investment opportunities using two key filters:
Terry Smith Quality Screen:
- Return on Capital Employed (ROCE): Over 15 % (5-year average)
- Earnings Per Share (EPS) Growth: Over 7 % (10-year compound annual growth rate, CAGR)
- Free Cash Flow (FCF) Growth: Over 5 % (5-year CAGR)
- Interest Coverage Ratio: Greater than 10 x
These criteria focus on financial strength and stability.
Growth Quality Screen:
- ROCE: Over 15 % (5-year average)
- Sales Growth: Over 15 % (5-year CAGR)
- FCF Growth: Over 10 % (5-year CAGR)
- Operating Margins: Positive and consistent
These filters ensure a focus on companies with solid growth potential and financial health. Once screened, evaluate each candidate for fundamentals, industry position, and price stability. Emphasize market leaders or businesses expanding their market share.
Portfolio Rules
Building a portfolio requires thoughtful position sizing and risk management. Follow these guidelines:
| Portfolio Element | Guidelines |
|---|---|
| Position Sizing | Adjust positions based on asset volatility to maintain diversification. |
| Sector Diversification | Spread investments across sectors to reduce concentration risk. |
| Geographic Diversification | Include assets from various regions to manage regional risks. |
| Rebalancing | Regularly review and rebalance to maintain target allocations. |
| Stop-Loss | Use stop-loss orders (2-3 x the Average True Range, ATR) for risk control. |
Effective position sizing and diversification are critical for minimizing risk. Studies show that proper position sizing can reduce average portfolio drawdowns by 37 % within a year.
With these principles in place, apply the filters to select stocks and finalize the portfolio.
Example Filter Application
Here's how to apply these guidelines step by step:
-
Quality Assessment
Examine the fundamentals:- Check for consistent ROCE over five years.
- Review trends in operating margins.
- Analyze the interest coverage ratio for stability.
-
Growth Evaluation
Assess growth potential:- Compare sales CAGR to the sector average.
- Evaluate the sustainability of FCF growth.
- Look for consistent EPS growth over time.
-
Risk Control
Manage portfolio risk:- Adjust position sizes based on asset volatility.
- Set stop-loss levels using ATR.
- Monitor diversification to avoid overexposure.
These 3 Filters Will Change Your Investment Game!
Conclusion
A solid three-filter strategy relies on disciplined, data-focused analysis. By combining financial strength analysis, growth evaluation, and multi-factor scoring, investors can identify quality opportunities while managing risk effectively.
"The Sharpe Ratio measures how well your trading strategy balances returns and risk. A higher Sharpe Ratio means better risk-adjusted performance."
This highlights the importance of maintaining a systematic and balanced approach. The key elements for successful execution include:
- Consistent Application: Regularly updating filter criteria to reflect market conditions while sticking to core quality benchmarks.
- Risk Management: Employing consistent position sizing and using stop-loss orders to protect investments.
- Systematic Evaluation: Adhering to the screening process to ensure companies meet all three filter requirements.
Strong portfolio management depends on ongoing monitoring and adjustments. The three-filter strategy offers a structured way to make decisions grounded in measurable data, avoiding impulsive reactions to market changes.
FAQs
What is the three-filter strategy, and how does it help identify high-quality investments?
The three-filter strategy screens businesses for financial strength (high ROCE, low leverage), consistent growth (sales, earnings, and cash-flow expansion), and reasonable valuation (metrics such as PEG ratio). A company must clear all three data-driven hurdles, so investors avoid overpaying for growth stories or buying financially weak firms.
What financial metrics should I evaluate to determine a company's financial health?
When analyzing a company's financial health, focus on consistent earnings growth, high return on capital, and strong cash flow. These indicators reveal the company's ability to generate profits, reinvest effectively, and maintain liquidity.
Additionally, pay attention to metrics like gross margins, operating margins, and free cash flow margins, as they provide insights into profitability and operational efficiency. Evaluating these metrics together can help you identify high-quality investment opportunities with strong fundamentals.
How can investors adapt the multi-factor scoring method to changing market conditions?
Investors can adapt the multi-factor scoring method to align with different market conditions by focusing on flexibility and adjusting key factors based on prevailing trends. For example, during periods of economic growth, they might prioritize growth metrics like revenue or earnings growth. Conversely, in uncertain or volatile markets, they could shift focus to stability factors such as cash flow, debt levels, or dividend consistency.
To fine-tune the method, consider regularly reviewing market data and recalibrating factor weightings to reflect current conditions. This data-driven approach ensures your investment strategy remains relevant and effective over time.


