Learn how to effectively use horizontal levels in trading to improve entry and exit strategies, manage risks, and enhance market analysis.
Horizontal levels are simple yet powerful in trading. They represent price points where markets previously showed support (buying interest) or resistance (selling interest). Here's a quick breakdown of their importance:
- Why They Matter: Help time entries/exits, set stop-losses, spot Oscillator Matrix toolkit reversal signals, and anticipate market reactions.
- How to Identify: Focus on historical price action, prioritize closing prices over wicks, and watch for round numbers like $50 or $100.
- Key Tools: Use charting platforms like TradingView to draw levels. Combine with indicators like moving averages or RSI for better accuracy.
- Common Mistakes: Treat levels as zones, not fixed points. Validate with volume and avoid relying solely on levels without considering trends or volatility.
How to Find and Draw Perfect Support and Resistance Zones
Finding Horizontal Levels on Charts
Understanding how to spot horizontal levels on your charts is crucial for improving your trading decisions. These levels, drawn from historical price movements, can provide valuable insights when identified properly.
Key Features of Strong Levels
The strength of a horizontal level often depends on how many times it has been tested. The more touches, the stronger the level. When identifying these levels, prioritize closing prices over wicks to ensure better accuracy.
Round numbers also play a big role in the Candle Body Support & Resistance indicator from the Library. These levels—like $50, $100, or $1,000—often act as psychological barriers where traders place orders.
"Support and resistance are two foundational concepts in technical analysis. Understanding what they are and how they work is essential to correctly reading a price chart." – Investopedia
By keeping these features in mind, you can use charting tools effectively to mark critical levels.
Chart Tools for Level Drawing
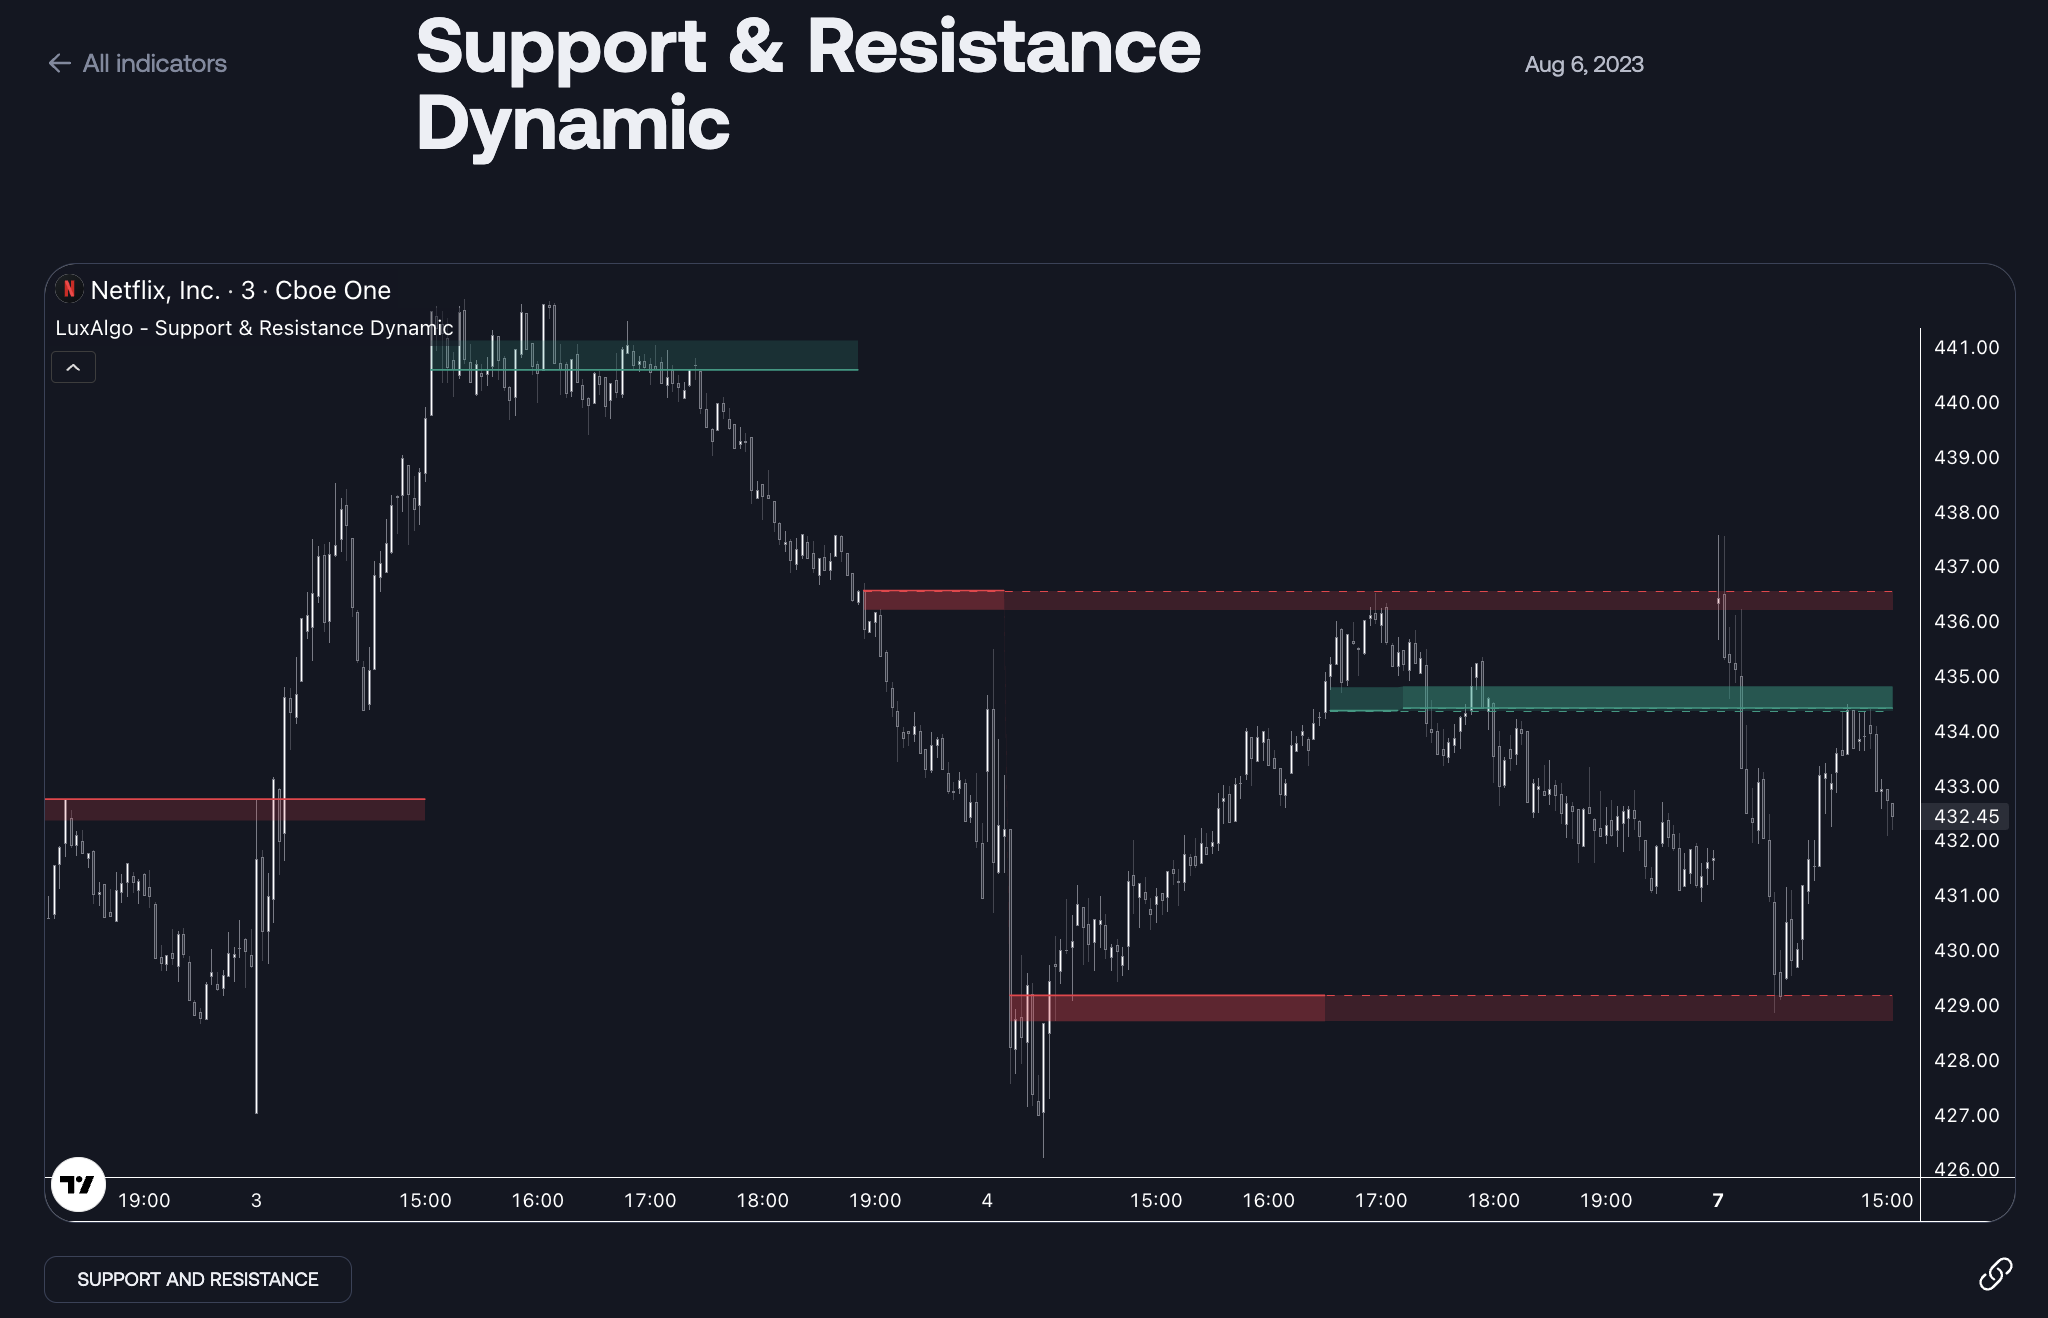
Platforms like TradingView offer simple yet effective lines and rays to mark key price levels. For deeper insights, use the Support & Resistance Dynamic indicator from the Library and the Price Action Concepts toolkit’s “Support and Resistance Levels with Breaks” feature to identify pivot points and potential breakouts.
Here are a few tips for drawing levels effectively:
- Start by marking major levels just above and below the current price.
- Adjust your lines to account for multiple price points, focusing on close prices.
- Use volume indicators to validate the importance of these levels.
Avoid common mistakes to ensure your levels are reliable and actionable.
Top Mistakes in Level Analysis
One major pitfall is treating horizontal levels as precise points instead of ranges. Buyers and sellers often act within a zone, not at a single price.
Another mistake is relying solely on horizontal levels without factoring in other market elements. For a more complete analysis, combine level identification with:
- Assessing market volatility
- Evaluating overall trend direction
- Confirming with volume data
- Using multiple timeframe analysis
"The key is to learn how to draw support and resistance levels correctly, so you give yourself the highest probability of success." – Hugh Kimura
Focus on the most relevant zones that show clear historical price reactions. Balance recent price activity with a broader historical context for better results.
Trading with Horizontal Levels
Entry and Exit Timing
Timing trades effectively depends on how the price behaves around key horizontal levels. When price nears these levels, it's important to wait for clear confirmation signals before making a move.
At support levels, keep an eye out for:
- Bullish candlestick patterns showing upward momentum
- Increased buying volume
- Clear rejection of lower prices
At resistance levels, watch for:
- Bearish candlestick patterns signaling downward pressure
- Higher selling volume
- Failed breakout attempts
For added confidence, combine these signals with other technical tools to validate your decisions.
Combining Levels with Other Tools
Pairing horizontal levels with additional indicators can refine your analysis and help filter out false signals.
| Tool Combination | Purpose | Application |
|---|---|---|
| Moving Averages | Trend Confirmation | Use a 50-day moving average to verify breakout strength near horizontal levels. |
| Volume Indicators | Level Strength | High trading volume helps confirm the importance of a level. |
| Oscillators (RSI/Stochastics) | Momentum Confirmation | Overbought or oversold signals suggest potential reversals at key levels. |
For example, the S&P 500 once formed a double-top pattern and dropped below its 50-day moving average, solidifying the reliability of a resistance level. By integrating tools like these, you can make horizontal levels a more dependable part of your trading strategy.
Setting Stops and Targets
Once you've confirmed your entry signals with supporting tools, it's time to manage risk with well-placed stops and clear profit targets. Stops should be positioned just beyond the horizontal level to avoid being shaken out by minor price fluctuations.
For long positions:
- Place your stop 1–2 ticks below the support level.
- Factor in the average daily range.
- Adjust your stop upward as the price moves in your favor.
For short positions:
- Set your stop 1–2 ticks above the resistance level.
- Take recent market volatility into account.
- Lower your stop as the price declines.
"The first discipline that any trader should master is to always limit your losses." – Incredible Charts
When setting profit targets, use the next key horizontal level as a guide. Ensure your risk-to-reward ratio aligns with your trading plan, and adjust your position size based on the distance between your entry and stop. This approach helps maintain consistent risk management across all trades.
Advanced Level Analysis Methods
Taking horizontal level trading to the next stage involves refining your approach for better accuracy in changing market conditions.
Timeframe Analysis
To master horizontal levels, it’s essential to analyze multiple timeframes. Levels identified on higher timeframes often hold more influence over market direction. Using a top-down approach helps cut through market noise and focus on dependable trading setups.
Here are some effective timeframe combinations to consider:
- Weekly + Daily: Ideal for swing trading while keeping an eye on long-term trends.
- Daily + 4H: Suited for short-term swing trades, balancing trend identification with precise entry points.
- 1H + 15min: Perfect for day trading, allowing quick trades within a broader market context.
Once you’ve identified key levels, the next step is to assess how breakouts and retests confirm their validity.
Level Breaks and Tests
To confirm a breakout is genuine, analyze the price action and the surrounding context. A true breakout is characterized by strong momentum and a decisive close beyond the horizontal level. Look for these signs to validate a breakout:
- The price closes beyond the level for two or more periods.
- Momentum aligns with the breakout direction.
- A retest of the level shows rejection, reinforcing its significance.
- The breakout aligns with the dominant trend on higher timeframes.
"False-breakouts are exactly what they sound like: a breakout that failed to continue beyond a level, resulting in a 'false' breakout of that level." – Nial Fuller
Instead of trying to predict moves, waiting for confirmation can help you avoid falling for false signals.
Volume and Level Strength
Volume plays a crucial role in assessing the strength of a level. Rising volume near a key level often indicates heightened market interest. Here’s how to interpret volume patterns:
- Increasing volume during breakouts: Suggests strong market conviction.
- Declining volume near a level: Could signal weak support or resistance.
- Wide EquiVolume boxes at key levels: Reflect significant price acceptance.
For stocks, pay attention to volume during breakout attempts. A breakout with high volume is generally more reliable, while low volume could lead to false moves. If prices rise while volume declines, this imbalance might hint at a potential reversal.
Trading Examples with Horizontal Levels
Trading in Trends
Horizontal levels can offer clear signals for entering trades during trending markets. For example, in an uptrend, when the price breaks above a previous swing high and then retests it as support, this often signals a strong entry point.
Here’s how to apply this in trend trading:
- Identify the trend direction by looking for higher highs and higher lows.
- Mark key swing points where resistance turns into support.
- Enter after a successful retest of the horizontal level.
- Confirm with bullish candlestick patterns for added confidence.
"Horizontal levels refer to specific price points on the chart where the price has previously encountered resistance or support. These levels are crucial in determining potential entry and exit points for trades".
Trading in Ranges
Horizontal levels are equally useful in range-bound markets, where the price moves between defined support and resistance zones. These levels help traders identify where to enter and exit trades effectively.
For range-bound trading, consider this approach:
- Enter near support and place stop-loss orders outside the range.
- Look for volume surges to validate potential entries.
- Confirm breakouts with decisive price closes above or below the range.
- Pay attention to volume activity at the range's extremes.
"The strength, or reliability, of the trendline as an area of support or resistance depends on the number of times the price has reacted to it".
Level Analysis Tips
To refine your trading strategy, incorporate these advanced techniques for analyzing horizontal levels:
- Use volume data to confirm the strength of the levels.
- Cross-check levels across multiple timeframes for consistency.
- Look for clear candlestick patterns at key levels.
- Wait for decisive price closes to confirm the level's validity.
"Support and resistance levels are a price action trader's 'best friend'. When a price action entry signal forms at a key level of support or resistance, it can be a high-probability entry scenario".
Summary
Horizontal levels play a key role in technical analysis by pinpointing price areas where past trading activity affects current market behavior. These levels often align with historical support and resistance zones, which have seen notable trading activity, making them useful for predicting potential market reactions.
What makes horizontal levels so effective? Their foundation lies in actual market behavior. As market research points out, "Horizontal levels emerge as a more reliable way to navigate technical charts because traders have something to gain or lose at a specific price point". This underscores their importance for traders, whether they're just starting out or have years of experience.
Here’s how you can apply this concept in trading:
- Validate Level Strength: Focus on levels that show multiple price touches and high trading volume.
- Use Multi-Timeframe Analysis: Check levels across different timeframes to confirm their reliability.
- Combine with Other Tools: Pair horizontal levels with volume indicators and trend analysis for a more complete picture.
And don’t forget: "Support and resistance levels are not precise numbers but rather ranges or zones". This mindset helps traders avoid the mistake of chasing exact price points and instead focus on identifying broader, actionable trading zones.
To succeed with horizontal levels, practice consistently and evaluate your approach regularly. A structured method for spotting and trading these levels can strengthen your overall analysis and decision-making process.