

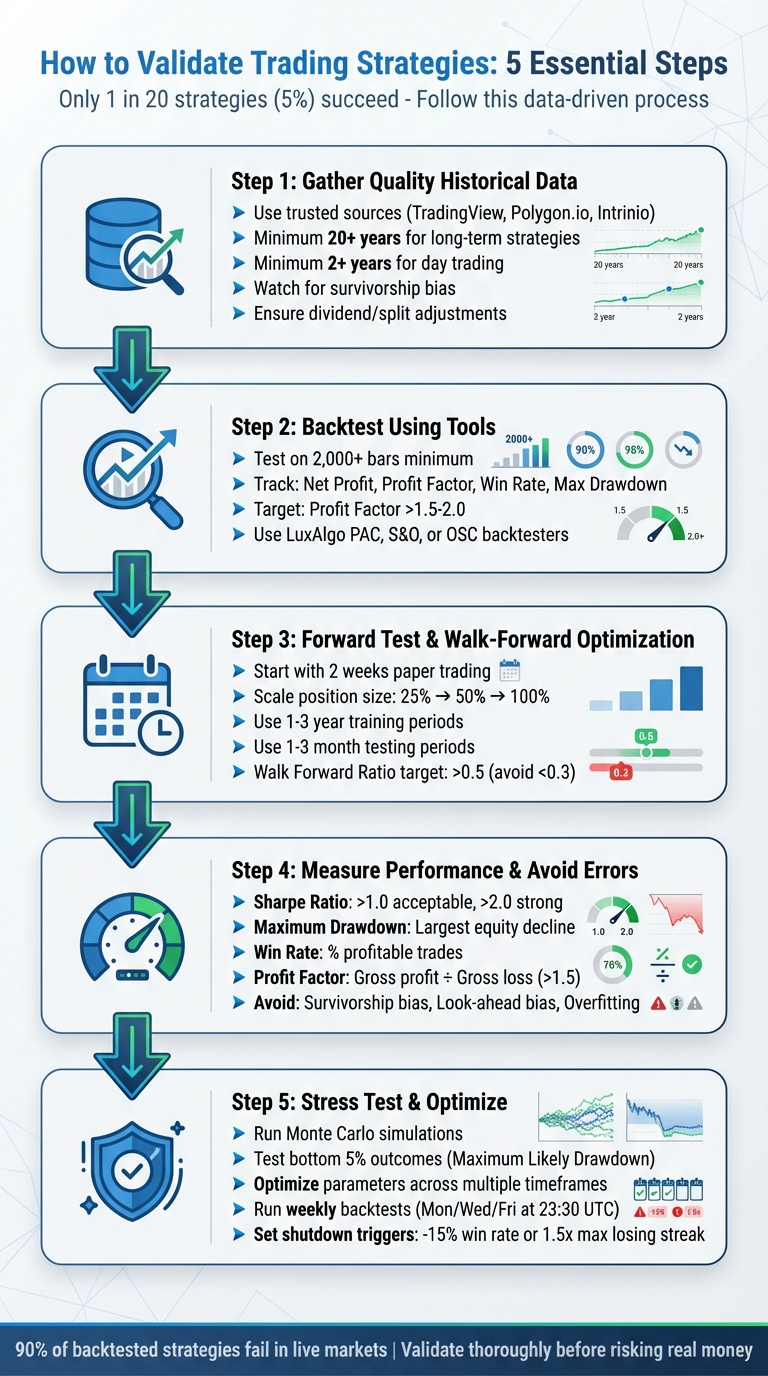
Validating a trading strategy is the difference between informed decision-making and gambling. Here's what you need to know:
- Why It Matters: Most strategy ideas do not survive the full path from backtest to live trading. A structured validation process helps reduce avoidable risk, exposes weak assumptions early, and improves the odds that a strategy can hold up outside of ideal historical conditions.
- Key Steps:
- Gather Quality Data: Use trusted sources, ensure long historical coverage, and avoid issues like survivorship bias or missing data.
- Backtest: Test your strategy on historical data to evaluate performance metrics like profit factor and drawdown.
- Forward Test: Simulate live trading with paper accounts to address execution challenges.
- Walk-Forward Optimization: Use rolling windows to fine-tune your strategy for changing market conditions.
- Stress Test: Apply simulations like Monte Carlo simulation to assess performance under extreme scenarios.
- Tools: Platforms like LuxAlgo help streamline validation with TradingView-compatible backtesters, the AI Backtesting Assistant, and LuxAlgo Quant for generating, validating, and debugging Pine Script® strategies when you want to move from an idea to testable code faster.
Bottom Line: A disciplined, data-driven approach helps determine whether a strategy is robust enough for live deployment. Always validate thoroughly before risking real capital.
Step 1: Gather Quality Historical Data
The accuracy of your strategy validation depends entirely on the quality of the data you use. If the data is flawed, even advanced testing methods can lead to unreliable conclusions. That’s why starting with solid, accurate historical data is non-negotiable.
The first step is ensuring your dataset spans a long enough period to capture a variety of market conditions. This means including major bull and bear phases, regime shifts in volatility, monetary policy changes, and market shocks such as the 2008 financial crisis, the 2020 pandemic selloff, and the inflation-driven swings seen in 2022–2023. In addition, you should choose trusted data sources, select the right timeframe, and prepare the dataset carefully before running any tests.
Pick Trusted Data Sources
Reliable data sources are the backbone of any effective validation process. Platforms like TradingView or broker APIs are practical options for many retail traders because they provide broad market coverage and chart-ready historical data. For more specialized needs, providers such as Polygon.io, Intrinio, or FMP API offer more granular datasets, though they usually cost more. If you only need end-of-day data, Yahoo Finance can still be useful, but it is generally less suitable for serious intraday validation.
Pay close attention to corporate action adjustments. Stock splits and dividends can materially distort your results if they are not handled correctly. To avoid skewed backtests, ensure your dataset includes adjusted pricing where appropriate, often labeled as adjClose or a similar field in an API.
Another important issue is survivorship bias. Many datasets only include currently listed securities, which can make historical performance look better than it really was because failed or delisted names are missing. If you are testing stock strategies, use a source that includes delisted securities whenever possible.
Finally, align your data resolution with your trading strategy so the inputs reflect how the strategy would actually operate in the market.
Choose Appropriate Timeframes
The resolution of your data should match the needs of your strategy. Daily data is often sufficient for swing trading and medium-term trend analysis, while intraday data—such as 1-minute, 5-minute, or tick-level data—is more appropriate for day trading, scalping, and automated strategies where precise execution timing matters.
Here’s a quick guide to matching data resolution with strategy type:
| Strategy Type | Data Resolution | Recommended History | Primary Use Case |
|---|---|---|---|
| Day Trading / Algorithmic | Minute / Hourly | 2+ years | High-frequency simulation, precise timing |
| Swing / Long-term | Daily (EOD) | 10–20+ years | Trend analysis, regime testing, portfolio evaluation |
Testing on too little data can lead to dangerous assumptions. For example, validating a strategy on only a short crypto bull run may capture hype rather than a durable edge. A larger sample of trades across multiple market regimes gives you more confidence that the results are not driven by chance alone.
Clean and Prepare Your Data
Once you’ve gathered high-quality, well-timed data, the next step is cleaning and aligning it to avoid errors during testing.
Start by addressing missing data points. Gaps can create false signals or make non-existent trends look real. Depending on the strategy, you may fill gaps with the last traded price, remove affected periods, or flag sessions as unusable.
Another crucial step is standardizing timestamps. Different providers may use different time zones, exchange session logic, or session boundaries. If you combine data from several sources, normalize timestamps first so your indicators and entries are calculated consistently.
Outliers also need attention. Price spikes caused by bad ticks, feed glitches, or stale prints can distort results. Use automated checks to identify anomalies and verify whether they reflect true market activity.
Finally, make sure your testing logic is free from look-ahead bias. A common mistake is using information from a completed candle to assume an entry that could only have happened earlier on that same candle. If you are coding or refining a TradingView strategy, LuxAlgo Quant can help turn an idea into Pine Script faster and reduce logic errors during generation, validation, and debugging before you test it live.
Step 2: Backtest Using LuxAlgo Features
Once you’ve prepared accurate historical data, the next step is to thoroughly test your trading strategy. This is where a robust backtesting system matters. LuxAlgo provides specialized backtesters on TradingView for Price Action Concepts, Signals & Overlays, and Oscillator Matrix. These backtesters automate entries, exits, and risk logic while displaying key metrics such as profit and loss, win rate, and drawdown directly on the chart.
Run Strategies with LuxAlgo Backtesters
Each LuxAlgo backtester is tailored to a different style of analysis:
- The PAC backtester focuses on concepts such as order blocks, fair value gaps, liquidity events, and broader price-action structure.
- The S&O backtester is designed for signal-based and overlay-driven workflows, including trend-following and reversal logic.
- The OSC backtester centers on momentum, money flow, divergence, and confluence-based analysis.
These backtesters help you standardize trade rules and review performance under consistent settings. To make results more realistic, configure starting capital, order sizing, commissions, spread or slippage assumptions, and margin settings before evaluating performance. You should also define a sensible backtesting window instead of relying on a cherry-picked date range.
If you are building a custom strategy rather than using an existing framework, Quant is especially useful because it is purpose-built for Pine Script® development on TradingView. Traders can use it to turn a plain-language idea into a testable indicator or strategy, validate the script structure, and debug issues before exporting the final logic to their charts.
Use the AI Backtesting Assistant
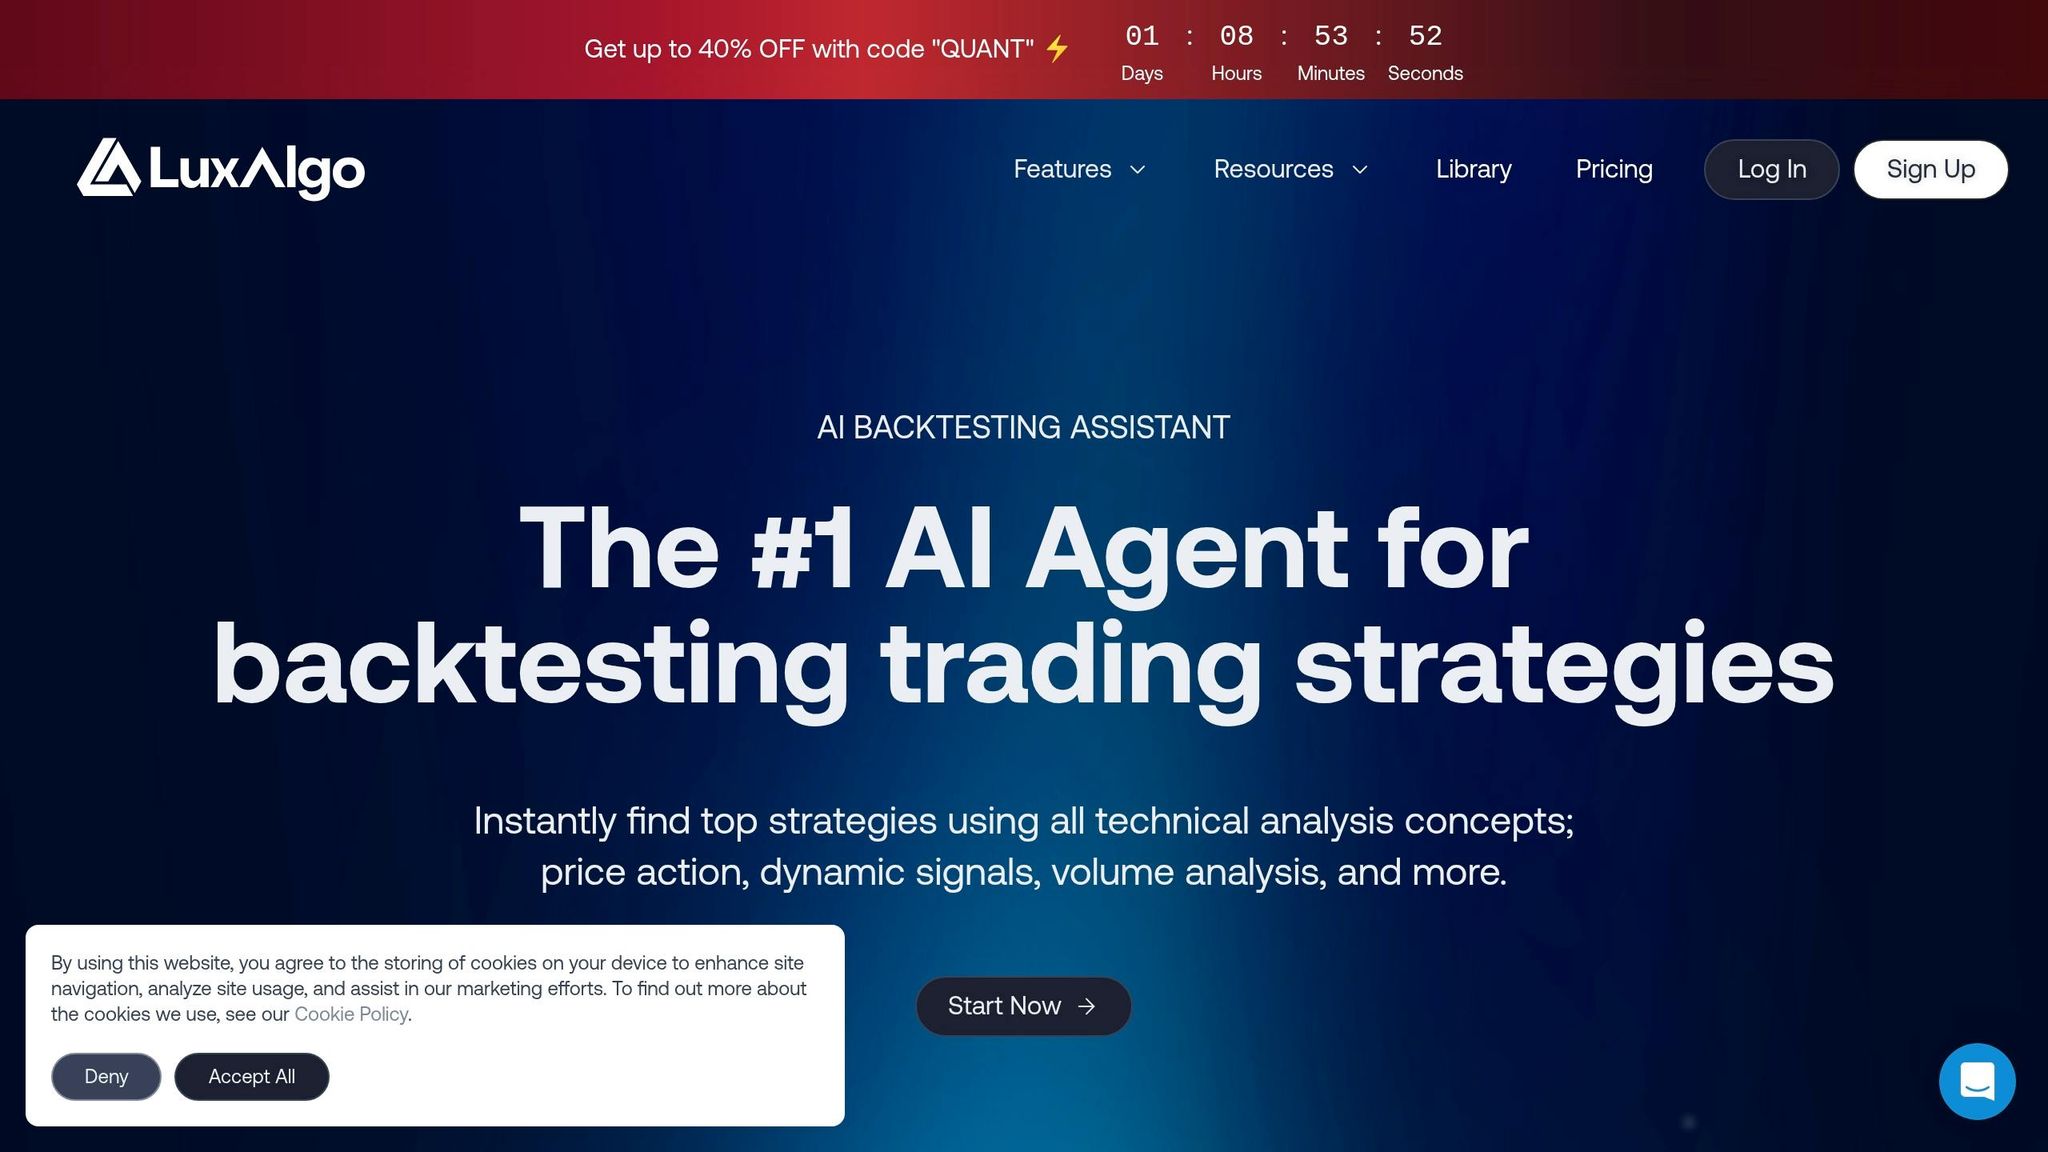
The AI Backtesting Assistant can speed up validation significantly by letting you search across a very large strategy database using natural language. Instead of manually iterating through many combinations of conditions, tickers, and timeframes, you can ask the assistant to find strategies that match a specific concept, market, or risk profile. LuxAlgo’s current public product page describes the assistant as scanning 10M+ backtested strategies.
This workflow is useful across several markets, including stocks, ETFs, crypto, forex, futures, and commodities. Once you find a promising strategy, you can bring it into TradingView for further review, parameter tuning, and manual verification against live charts.
Backtests are refreshed on a recurring schedule, helping traders work with recent data rather than relying on stale snapshots. This matters because a strategy that looked strong six months ago can degrade materially after a market regime shift. The feature is part of LuxAlgo’s broader AI trading workflow and is included on the Ultimate plan.
Read Your Backtesting Results
Running a backtest is only half the process; interpreting the output correctly matters just as much. Focus on a balanced group of metrics instead of chasing the highest possible net profit.
- Net Profit
- Profit Factor
- Win Rate
- Max Drawdown
- Average Winning and Losing Trades
A Profit Factor above 1.5 can indicate that a strategy has a workable edge, but it should be judged alongside drawdown, trade frequency, and execution assumptions. Compare average wins to average losses carefully; if expected profits are too small, commissions, spread, and slippage may erase the edge in live trading.
You can also filter results by long versus short trades, holding time, or date range to identify where a strategy performs well and where it struggles. Minor differences may still appear between a platform-level AI backtest and a live chart because of differences in data feeds, candle construction, or execution rules, so always verify critical results inside TradingView before deploying real capital.
Step 3: Apply Forward Testing and Walk-Forward Optimization
Backtesting shows how a strategy behaved in the past. Forward testing shows how it behaves when new data arrives and you can no longer benefit from hindsight. These two stages work together: backtesting establishes a baseline, while forward testing checks whether the edge survives under current market conditions.
Run Forward Tests
After backtesting, move to a paper-trading environment and track the strategy in real time. A useful starting point is at least two weeks of paper trading for active strategies, though longer is better for lower-frequency systems. This lets you see how the strategy handles practical issues such as slippage, spread expansion, execution lag, and missed fills.
"Paper trading is not optional, it's a requirement. If your strategy doesn't survive two weeks in demo, it won't survive in live trading."
Here’s a quick comparison of backtesting and forward testing:
| Feature | Backtesting | Forward Testing |
|---|---|---|
| Data Type | Historical Market Data | Live Market Data |
| Time Required | Fast (Hours or Days) | Real-time (Weeks/Months) |
| Market Conditions | Past Scenarios | Current Dynamics |
| Execution Focus | Strategy Mechanics | Practical Issues (e.g., Slippage, Latency, Fees) |
This staged approach reduces the risk of going live too early. If the strategy remains consistent in paper trading, you can gradually increase size instead of jumping straight to full allocation.
Use Walk-Forward Optimization
If forward tests are promising, the next step is walk-forward optimization. This method helps a strategy adapt to changing conditions by repeatedly training on one segment of data and testing on the next unseen segment.
A common structure uses a rolling window—for example, 1–3 years of training data followed by 1–3 months of testing data. After the test period ends, roll the window forward and repeat the process. This gives you multiple out-of-sample validations instead of a single lucky result.
One simple robustness check is the Walk-Forward Ratio, which compares out-of-sample performance with in-sample performance. If the out-of-sample results collapse relative to the training results, the strategy may be overfit.
It also helps to include a short buffer period between training and testing windows so signals do not unintentionally leak future information into the model. That extra separation can improve the realism of your validation process.
Step 4: Measure Performance and Avoid Common Errors
After backtesting and forward testing, you need a consistent way to judge whether the strategy is truly viable. That means tracking key metrics and avoiding the common mistakes that make weak systems appear stronger than they are.
Track Key Performance Metrics
These metrics are especially useful when evaluating a strategy:
- Sharpe Ratio: Measures risk-adjusted return. Higher is generally better, but it should be interpreted in context with trade frequency and distribution of returns.
- Maximum Drawdown: Measures the largest peak-to-trough decline in account equity.
- Win Rate: Shows the percentage of profitable trades, but it means little on its own without average win and average loss.
- Profit Factor: Compares gross profit to gross loss. Values above 1.5 are often viewed as a healthy starting point, assuming costs are included.
Always include transaction costs such as commissions, spread, financing, and slippage when reviewing these numbers. A strategy should still look reasonable after realistic frictions are applied, not just under ideal assumptions.
Prevent Overfitting and Data Biases
"If you torture the data long enough, it will confess to anything."
This quote captures the core problem of overfitting: a strategy can be tuned so aggressively to historical noise that it looks excellent in a backtest and then fails when market conditions change.
Be especially cautious of these biases:
- Survivorship Bias: Testing only on assets that still exist today.
- Look-Ahead Bias: Using future information that would not have been available at the time of the trade.
- Data-Snooping Bias: Testing so many variations that one appears profitable by luck alone.
To reduce these risks, test the strategy across bull, bear, and sideways conditions. You should also keep the rule set simple enough that the logic makes economic and behavioral sense, not just statistical sense.
Keep Trade Logs and Reproducible Settings
Good validation is not only about performance; it is also about repeatability. Keep detailed logs of parameter changes, trade outcomes, execution assumptions, and market context. A spreadsheet or research journal works well for this.
When you move into live trading, compare real-time outcomes against the original backtest. This can help you catch execution problems, changing volatility conditions, or early signs of alpha decay before losses become larger.
"No matter how good your backtest is, the first contact with the real market always reveals differences."
If you are maintaining custom TradingView code, this is another area where LuxAlgo Quant can be useful. It helps traders iterate on Pine Script logic faster, validate revisions, and troubleshoot bugs without treating a generic AI chatbot as the source of truth for production code.
Step 5: Stress Test and Optimize with LuxAlgo Ultimate
After backtesting and forward testing, the next goal is to understand how fragile or resilient your strategy is under extreme conditions. Stress testing and parameter optimization help answer that question, and LuxAlgo Ultimate is geared toward this stage of the workflow.
Stress Test with Monte Carlo Simulations
Monte Carlo simulation tests robustness by reshuffling or resampling trade sequences to generate many alternative equity paths. This helps expose sequence risk—one of the main reasons a strategy can feel safe in a standard backtest but become psychologically or financially difficult to trade in real life.
Instead of focusing only on the best outcome, pay attention to downside scenarios such as the lower-tail drawdown distribution. Those results are often more useful for deciding how much capital to allocate and what shutdown thresholds to define before going live.
Metrics such as probability of profit, probability of ruin, and worst-case drawdown estimates can help reveal whether a strategy has a real edge or is overly dependent on favorable sequencing. This is also where pre-defined risk limits become valuable: a strategy that looks profitable on paper may still be untradeable if the downside path is too severe.
LuxAlgo’s AI Backtesting workflow can help traders review large sets of strategy candidates quickly, then narrow them down for more detailed stress testing and manual review.
Optimize Parameters with the Deep Optimization Engine
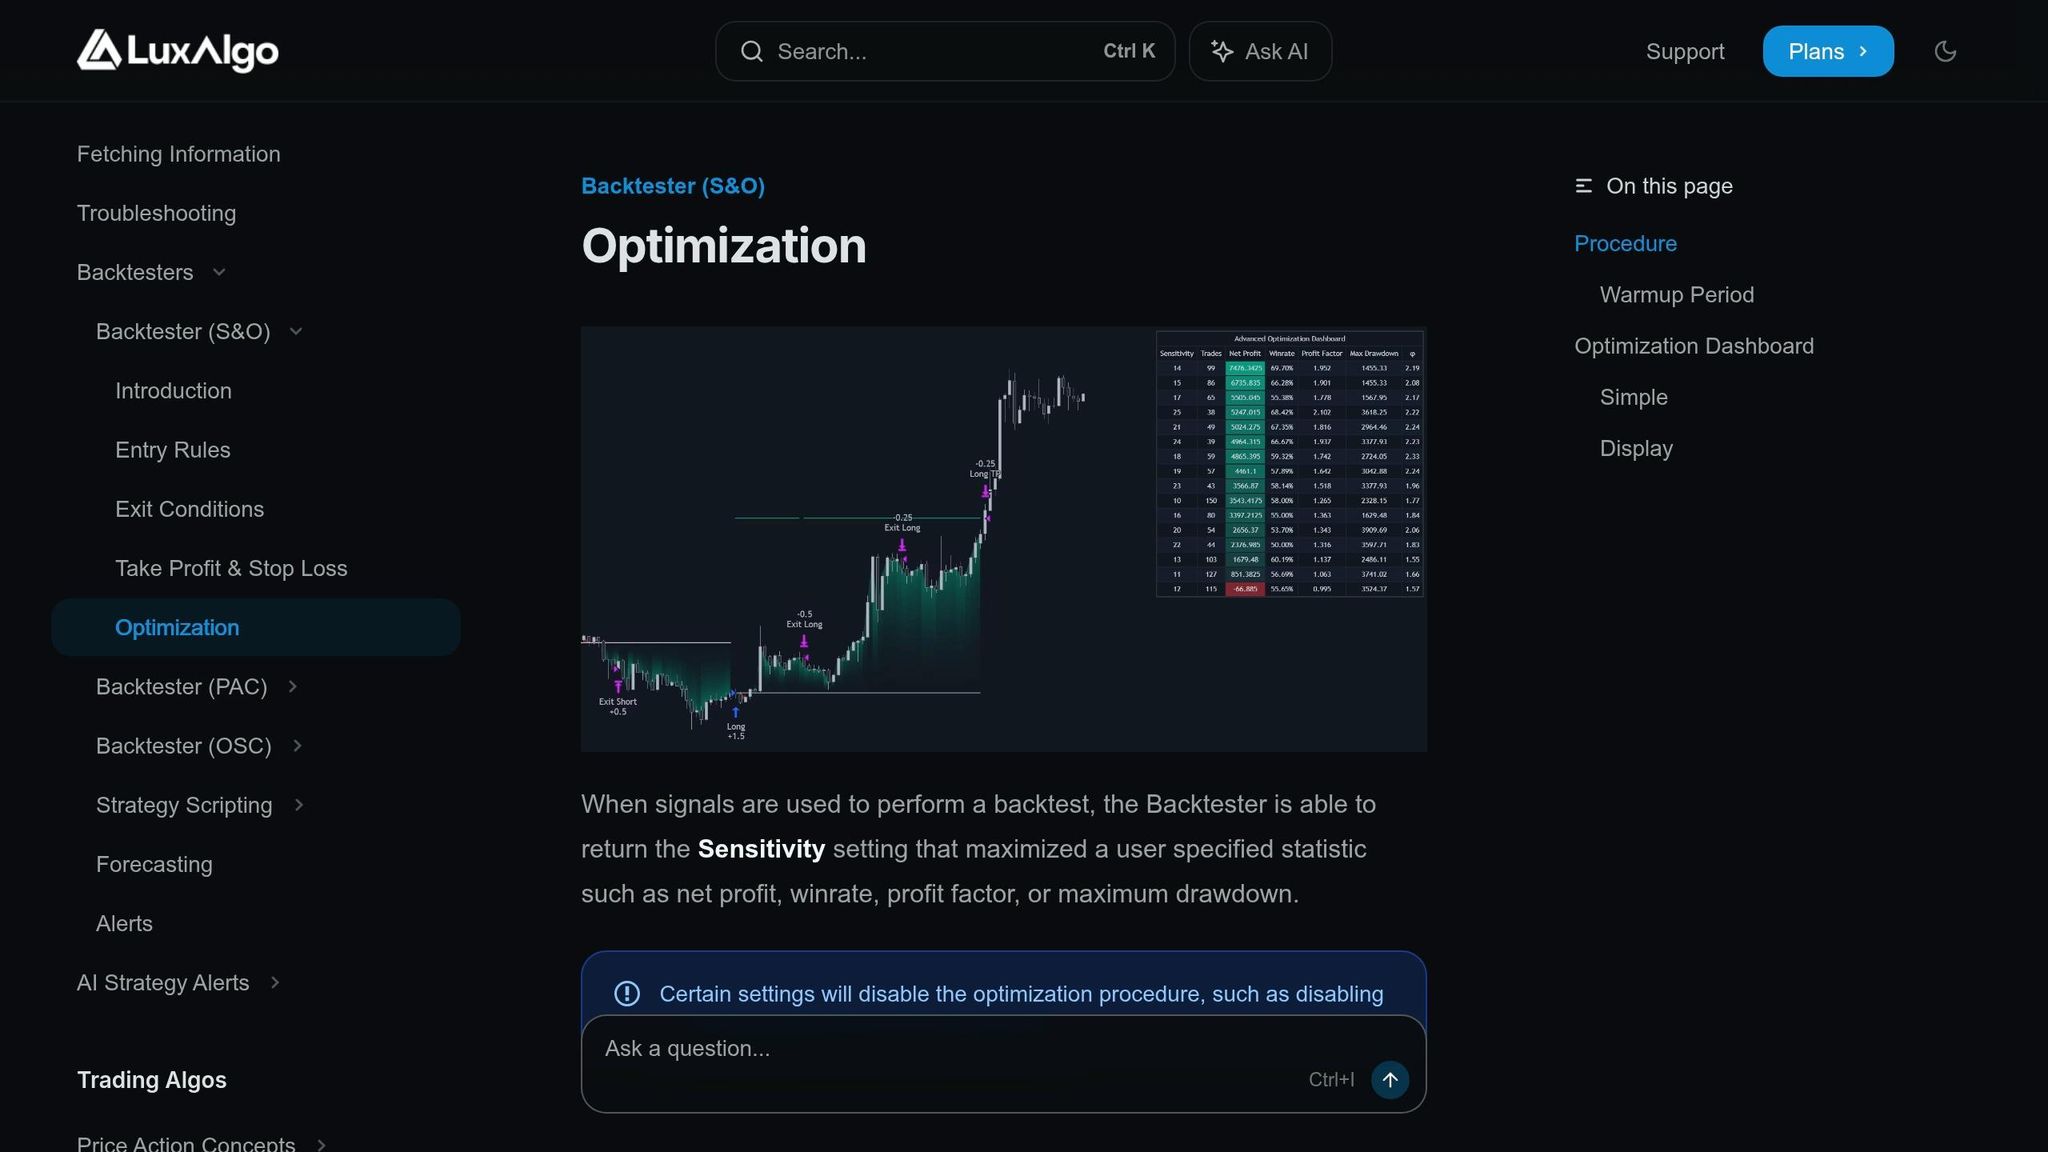
After stress testing, parameter optimization helps you look for stable ranges rather than a single perfect setting. LuxAlgo’s optimization tools make it easier to evaluate zones where performance remains acceptable across multiple parameter values.
This is a more robust approach than chasing the absolute best historical result. If performance only works at one narrow setting, the strategy may be too fragile for live trading. By contrast, a broader stable zone suggests the underlying logic may be more durable.
The practical goal is not to maximize one number at all costs. It is to find a configuration that balances return, drawdown, consistency, and execution realism.
Run Weekly Backtests for Ongoing Refinement
Markets do not stand still, and a strategy that worked well last quarter can weaken as volatility, liquidity, and participation change. That is why ongoing review matters. Re-running tests on a regular schedule helps you spot deterioration before it becomes expensive.
Before going live, define shutdown rules in advance. For example, you may pause the strategy if the live win rate falls meaningfully below the validated range, if drawdown exceeds a pre-defined threshold, or if execution quality deteriorates beyond the assumptions used in testing.
Weekly or periodic retesting also helps you compare live performance against the original backtest and stress-test expectations. If reality begins to diverge materially, that is a signal to reduce risk and re-evaluate the strategy logic rather than forcing trades.
Conclusion
A data-driven process is central to validating any trading strategy. Good validation starts with reliable historical data, moves through disciplined backtesting and forward testing, and continues with walk-forward analysis, stress testing, and ongoing monitoring.
Metrics such as Profit Factor, Sharpe Ratio, and Maximum Drawdown help determine whether a strategy is not only profitable on paper but also realistic to trade. Common mistakes—such as skipping out-of-sample testing, ignoring execution costs, or over-optimizing to noise—can make weak strategies look stronger than they really are.
Stress testing, including Monte Carlo analysis, and clearly defined stop criteria are important before moving to live capital. Trading is not about hoping the backtest repeats perfectly; it is about preparing for a range of possible outcomes.
LuxAlgo supports this workflow at several levels. Its TradingView-compatible backtesters help standardize strategy testing, the AI Backtesting Assistant helps traders find and compare strategy candidates faster, and Quant can shorten the path from concept to deployable Pine Script when you need to build, refine, or debug a custom indicator or strategy.
When transitioning to live trading, start small. Compare live performance against the assumptions from your testing, scale gradually, and keep detailed records. The goal is not to prove a strategy works once—it is to build confidence that it can keep working under realistic conditions.
FAQs
How much historical data is enough to validate a strategy?
As a rule of thumb, try to evaluate at least 200–500 trades across multiple market conditions. While smaller samples can still be informative, they are less reliable because randomness has a larger effect on the results. The more regimes your sample includes, the more useful the conclusion becomes.
How do I know if my backtest is overfit or biased?
Warning signs include strong sensitivity to small parameter changes, dependence on one narrow market period, and poor performance on out-of-sample data. If a strategy looks excellent in-sample but breaks down quickly when tested on unseen data, it is likely overfit. Overly optimistic metrics that vanish after adding slippage and commissions are another common sign.
What’s the safest way to size trades when going live?
The safest starting point is to use disciplined risk management. Many traders cap risk per trade at roughly 1–2% of account equity so a single loss cannot heavily damage the account.
It is also smart to size positions relative to volatility. For example, the Average True Range (ATR) can help you estimate current market movement and adjust position size accordingly. Combining fixed-percentage risk with volatility-aware sizing creates a more stable framework for going live.
References
LuxAlgo Resources
- LuxAlgo
- AI Backtesting Assistant
- LuxAlgo Quant
- Quant Introduction
- Price Action Concepts Introduction
- Oscillator Matrix Introduction
- Fair Value Gap
- Deep Optimization Engine
- Stress Testing for Trading Strategies