How to Write Pine Script for Trading Indicators
LuxAlgo Quant helps you turn an indicator idea into code on a LuxAlgo chart. You can describe the calculation, review the generated Pine Script®, run it, and adjust its inputs alongside price. Learning the language makes that process easier to audit and gives you more control over the result.
Pine Script® is TradingView’s language for indicators and strategies, and since 2025 it is no longer bound to one platform. LuxAlgo charts run it natively through PineTS, our open-source Pine Script® runtime; the same engine runs it on Vela™, our open-source charting library, and in plain Node.js. You can also develop in TradingView’s Pine Editor. Retest on each platform you intend to use: data feeds and sessions can differ even when the runtime does not.
Key Takeaways:
- Core structure: This guide’s indicators use
//@version=6,indicator(), calculations, and output. - Custom Indicators: Use built-in functions like
ta.sma()for moving averages orta.macd()for MACD calculations. - Interactive Settings: Add
input()functions for adjustable parameters without editing the code. - Build and test: Review code and run it on a LuxAlgo chart, then retest in TradingView’s Pine Editor if you intend to use it there.
- Publishing: Share your scripts in TradingView's library with open, protected, or invitation-based access.
- Portability: The same v6 source runs on TradingView, on LuxAlgo charts, on a Vela™ chart in your own app, and in Node.js through PineTS.
This guide covers script structure, adjustable inputs, SMA and MACD calculations, and testing on LuxAlgo and TradingView. It also explains repainting checks and publishing. Stress testing comes later when you turn an indicator into a strategy with explicit trade and risk rules; it is a validation process, not a Pine Script® language feature.
Pine Script® v6: Full TradingView Scripting Course for Beginners
Pine Script® Basics
Understanding these basics is essential for creating custom indicators that align with your trading approach. If you also want ready-made studies to inspect and compare against your own logic, LuxAlgo’s Library provides a useful starting point.
Core Syntax and Structure
The indicator examples here use three parts: //@version=6, an indicator() declaration, and the calculation and plotting code. Specify the language version explicitly. Strategies use strategy() and libraries use library() instead; an indicator is not automatically a backtestable trading strategy.
Declare a variable with =, such as src = close, and reassign it with :=. Pine Script® works with values across bars. On a completed bar, close is its closing price; on an open realtime bar, it updates with the latest price. close[5] refers to the value five bars earlier, when that history is available.
Pine Script® also includes built-in functions to simplify technical analysis. For instance, ta.sma(source, length) calculates a Simple Moving Average, and ta.ema(source, length) computes an Exponential Moving Average. You can add comments to your code by using // to clarify your logic.
Here’s an example of a simple five-line indicator to illustrate these concepts:
//@version=6
indicator("My First Moving Average", overlay=true)
length = input.int(14, title="MA Length", minval=1)
ma_value = ta.sma(close, length)
plot(ma_value, color=color.blue, title="Moving Average")
Using the indicator() Function
The indicator() function is where you define your script's identity, key properties, and behavior. Every Pine Script® must include exactly one declaration statement for it to work. This function specifies the script's title (the full name visible in TradingView's Indicators menu), the short title (the name shown on the chart legend), and whether the indicator overlays the price chart or appears in a separate pane. Use overlay=true to show the indicator on the main price chart or overlay=false for a separate pane, like with MACD or RSI. Additionally, the precision parameter determines how many decimal places are displayed for the indicator's values.
An indicator needs an output, such as plot(), plotshape(), or barcolor(). The example plots the average of 14 closing prices. Before interpreting it as a signal, check that the line matches the intended calculation.
Run and Check the Example on LuxAlgo
- Open a LuxAlgo chart and select the symbol and interval you want to study.
- Use Quant to build the indicator or review its script in Code, then select Run.
- Open the indicator’s Settings → Inputs to change the length. For a completed bar, compare the plotted SMA with the arithmetic mean of that bar’s close and the preceding closes in the selected window.
- Observe an open bar and then a closed bar. An SMA based on
closenormally moves while the current bar is forming.
Use inputs for parameter changes and Quant for changes to the calculation itself. The native indicator guide explains chart settings and indicator management.
Pine Script® v6 at a Glance
Every example in this guide is v6. If you are copying code from older tutorials or the Public Library, this is the context you need before it compiles.
| Version | Released | What it added | Why it mattered |
|---|---|---|---|
| v1 | 2013 | The language itself: series values, built-in indicators, plots | Traders could write an indicator without leaving the chart |
| v2 | 2015 | if statements, security requests | Logic stopped being a chain of ternaries |
| v3 | 2017 | String support, more technical-analysis functions, repainting fixes for requests | Scripts became readable programs rather than formulas |
| v4 | 2019 | var declarations, drawing objects (label, line), later arrays (2020) | Stateful scripts and on-chart drawings; the first real strategies at scale |
| v5 | October 2021 | Namespaces (ta., math., str.), libraries, switch; later user-defined types, methods, matrices and maps | Reusable code and structured data; the version most published scripts still run |
| v6 | November 2024 | Dynamic requests, enums, strict booleans with lazy evaluation, text formatting, negative array indexing | Scripts can request data inside loops and conditions; fewer silent na bugs |
The v6 changes a beginner will meet first: a bool can only be true or false, so test the underlying number with not na(value); and and or stop evaluating once the result is known, so never hide a stateful ta.* call on the right-hand side; request.security() accepts series strings and works inside loops; and enum plus input.enum() replace string comparisons with a dropdown. TradingView has shipped monthly updates since launch, including bid and ask on tick charts, an active parameter on inputs, and request.footprint() in January 2026. The migration guide covers the rest.
Setting Up Pine Editor on TradingView
Accessing Pine Editor
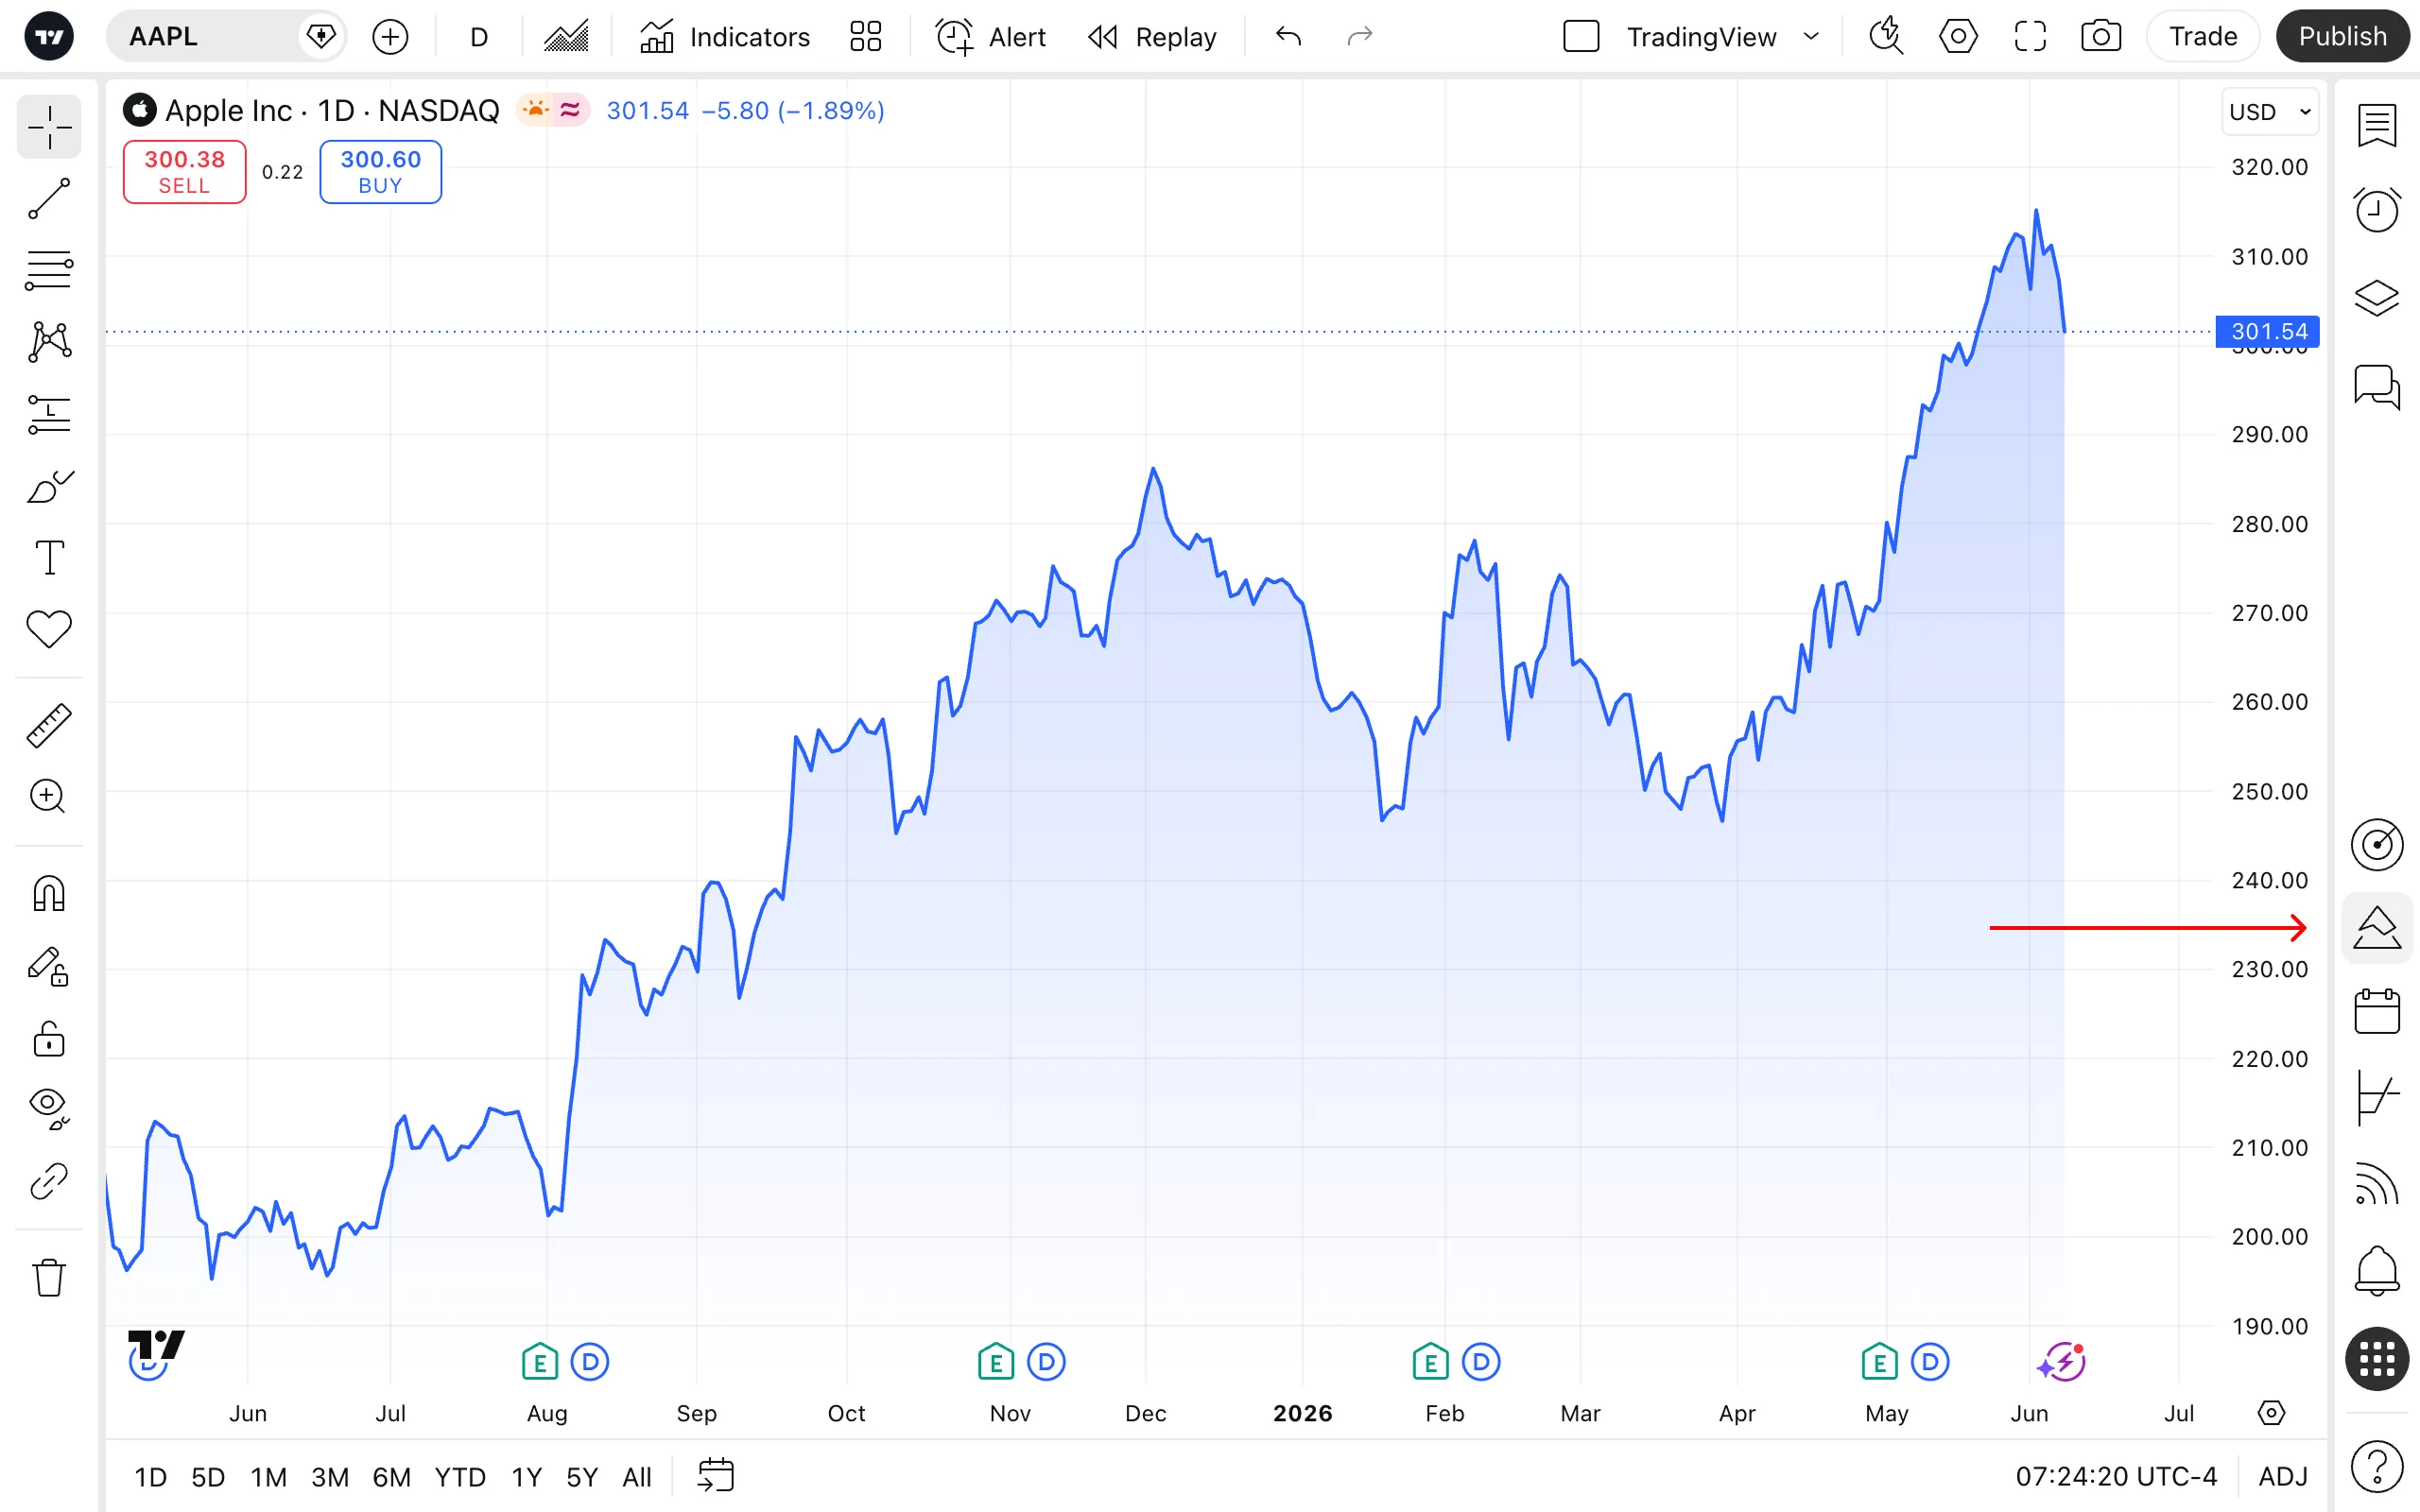
In TradingView, click the Pine icon on the right toolbar to open Pine Editor. It opens as a floating panel by default and can be docked or moved. Use the editor’s script menu to create an indicator, then enter your code. See TradingView’s current editor instructions if your layout differs.
Save the script with a clear name and choose Add to chart to compile and display it. When editing an existing chart script, use the editor’s update control to apply the revision. The editor restores its open state, but deliberately save versions you want to keep.
Editing and Testing Scripts
The Pine Editor provides syntax highlighting and autocomplete. Use its save and chart controls, or the shortcuts shown in your editor for your operating system. Compile after small changes so a new error is easier to isolate.
If your script contains errors - like syntax issues or undefined variables - they’ll appear in red in the console at the bottom of the editor. For debugging, you can use functions like plot() to visualize variable values directly on the chart or label.new() to display specific data points. Additionally, TradingView’s debugging and logging features can help you inspect runtime behavior more carefully. For traders who want a faster way to prototype, validate, or troubleshoot scripts, LuxAlgo Quant can help generate Pine Script® from natural-language prompts and refine logic on a LuxAlgo chart before you paste it into TradingView.
Once your script is error-free, you can take it a step further by adding interactive customization options.
Using Inputs for Customization
The Pine Editor allows you to create interactive settings using input functions like input.int(), input.float(), and input.bool(). These inputs let users adjust parameters without needing to modify the script itself. For example, the following snippet:
length = input.int(14, title="MA Length", minval=1)
creates a numeric field in the script's Settings menu, allowing users to change the moving average period. You can also add parameters like minval (e.g., minval=1) to restrict values to a logical range, preventing invalid entries.
Use tooltip for an explanation, group to place related inputs under a heading, and options for a fixed choice list. In a Quant prompt, specify the default, permitted range, and meaning of each input. Quant’s documentation explains the coding workflow.
Building Simple and Advanced Indicators
Creating a Simple Moving Average (SMA) Indicator
A Simple Moving Average (SMA) is one of the most straightforward indicators you can create in Pine Script®. Start by declaring //@version=6 and setting overlay=true so the SMA appears directly on the price chart.
To make the length adjustable, use input.int(20, "SMA Length", minval=1). This allows traders to easily set their preferred period, such as 20 or 50, without modifying the code. The built-in function ta.sma(close, length) calculates the average of closing prices over the specified period. Finally, use plot(smaValue, color=color.blue, title="SMA Line") to display the indicator on the chart.
Here’s the complete code for a basic SMA:
//@version=6
indicator("Simple Moving Average", overlay=true)
length = input.int(20, "SMA Length", minval=1)
smaValue = ta.sma(close, length)
plot(smaValue, color=color.blue, title="SMA Line")
To extend this example with Quant, request one change at a time, such as a second SMA or a marker when price crosses a line. State whether markers should wait for the chart bar to close, then inspect the generated condition and test it on the chart.
Developing a MACD Indicator
The MACD (Moving Average Convergence Divergence) is a more advanced indicator that involves multiple calculations: a fast EMA, a slow EMA, a signal line, and a histogram. Unlike the SMA, the MACD is displayed in a separate pane below the price chart, so set overlay=false.
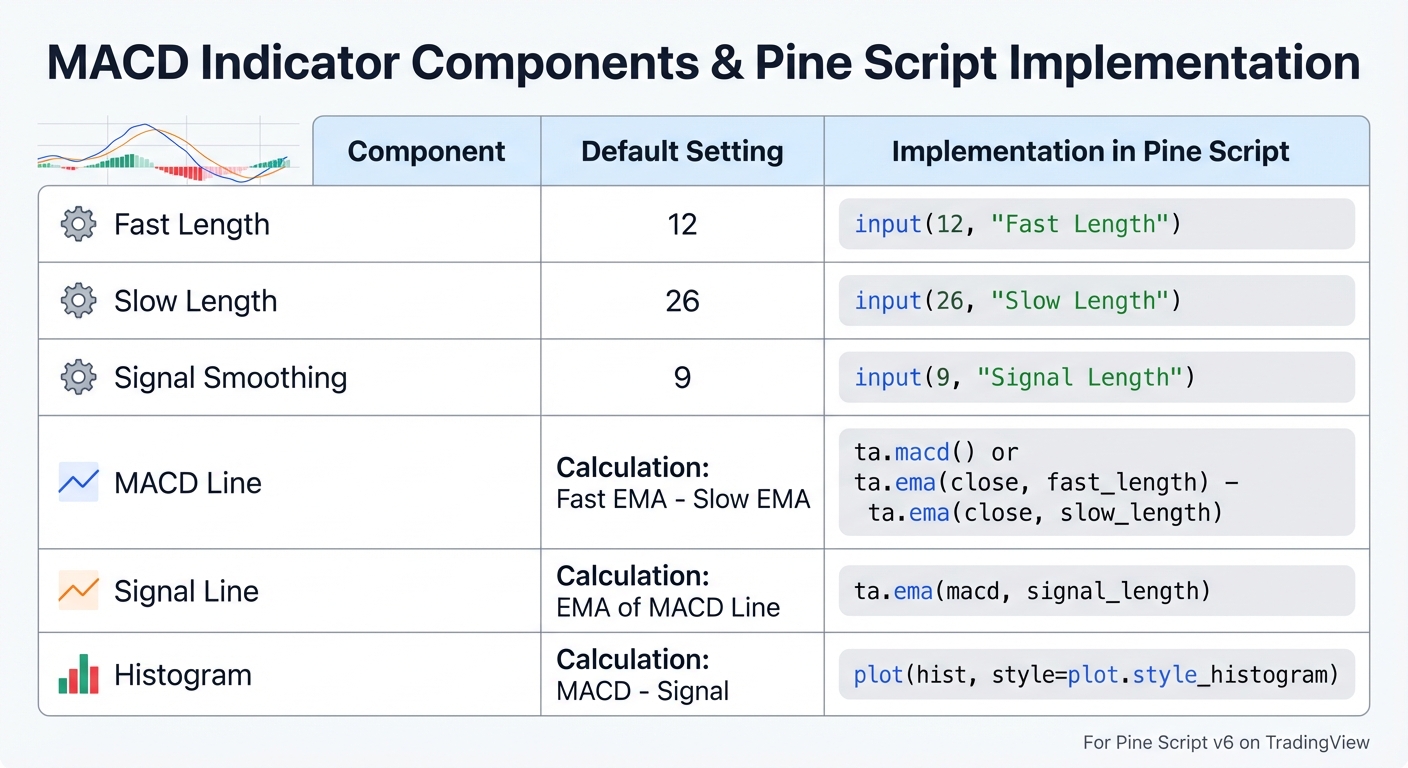
Start by adding inputs for the Fast Length (default 12), Slow Length (default 26), and Signal Smoothing (default 9) using input.int(). Pine Script® simplifies the process with ta.macd(), which calculates the MACD line, signal line, and histogram all at once: [macdLine, signalLine, histogram] = ta.macd(close, fast, slow, signal).
For visualization:
- Use
plot()to draw the MACD and signal lines. - Use
plot()withstyle=plot.style_histogramfor the histogram. - Apply conditional coloring to the histogram for better clarity:
color = histogram >= 0 ? color.green : color.red.
To provide a clear reference point, add a zero-line using hline(0). This makes it easier to spot crossovers and momentum shifts.
| Component | Default Setting | Implementation in Pine Script |
|---|---|---|
| Fast Length | 12 | input.int(12, "Fast Length") |
| Slow Length | 26 | input.int(26, "Slow Length") |
| Signal Smoothing | 9 | input.int(9, "Signal Length") |
| MACD Line | Fast EMA - Slow EMA | ta.macd() or manual calculation |
| Signal Line | EMA of MACD Line | ta.ema(macdLine, signal_length) |
| Histogram | MACD - Signal | plot(histogram, style=plot.style_histogram) |
For a signal that must wait for the chart bar to close, gate the condition with barstate.isconfirmed. This does not confirm data requested from a higher timeframe, and it does not work inside request.security(). Keep the calculations and the timing rule separate, as explained in TradingView’s bar-state documentation.
Using LuxAlgo Quant for Pine Script® Development
Quant is LuxAlgo’s coding agent inside its charting platform. Describe the indicator, inspect the code, and run it on the chart; use targeted follow-up requests to change the logic or presentation. For example: “Create an RSI with length 14, levels at 30 and 70, and a marker only when RSI crosses back above 30 on a closed chart bar.” A precise condition is easier to verify than a request for “good signals.”
Generating Code with Natural Language Prompts
Start with the calculation, source, defaults, and signal timing. Then refine the indicator with requests such as:
- "Add a 20-period SMA to the RSI"
- "Include alert conditions for overbought levels"
- "Adjust the colors and line widths"
For more complex indicators, you can even ask Quant to outline a plan before generating the code. This step-by-step approach helps your script evolve in a controlled and predictable way while keeping the logic easier to audit.
Image-to-Code Conversion and Optimization
You can give Quant a chart screenshot as a visual reference. Ask it to distinguish visible observations from inferred formulas, then specify the calculation you want. A screenshot can guide colors, layout, or a proposed signal rule; it does not reveal hidden settings or guarantee reproduction of a proprietary indicator.
If a script has a syntax or runtime error, use Fix with Quant and rerun it. For a logic problem, ask for intermediate plots or a simpler version and compare specific bars with your expected values. Code that runs successfully can still calculate the wrong condition.
Run on LuxAlgo and Retest in TradingView
Review the generated script in Code and select Run on LuxAlgo. If you also want to use it on TradingView, copy it into Pine Editor and compile there. Compare the same symbol, session, interval, inputs, and completed bars where possible; investigate data or feature differences rather than assuming identical output.
When you are ready to test trading rules, use the indicator’s native Backtest workflow to have Quant turn it into a strategy. Define entries, exits, sizing, and risk rules, then review commissions and slippage in Properties. An indicator plot alone does not produce a meaningful profit test. The native strategy guide covers results and settings.
Quant is available on the Free plan with 500 monthly credits. Paid plans provide higher limits; check current plans when choosing capacity.
Run the Same Indicator Outside TradingView
An indicator you wrote is an asset, and an asset is worth more when it runs in more than one place. Both indicators in this guide run unchanged on three other runtimes.
On LuxAlgo charts
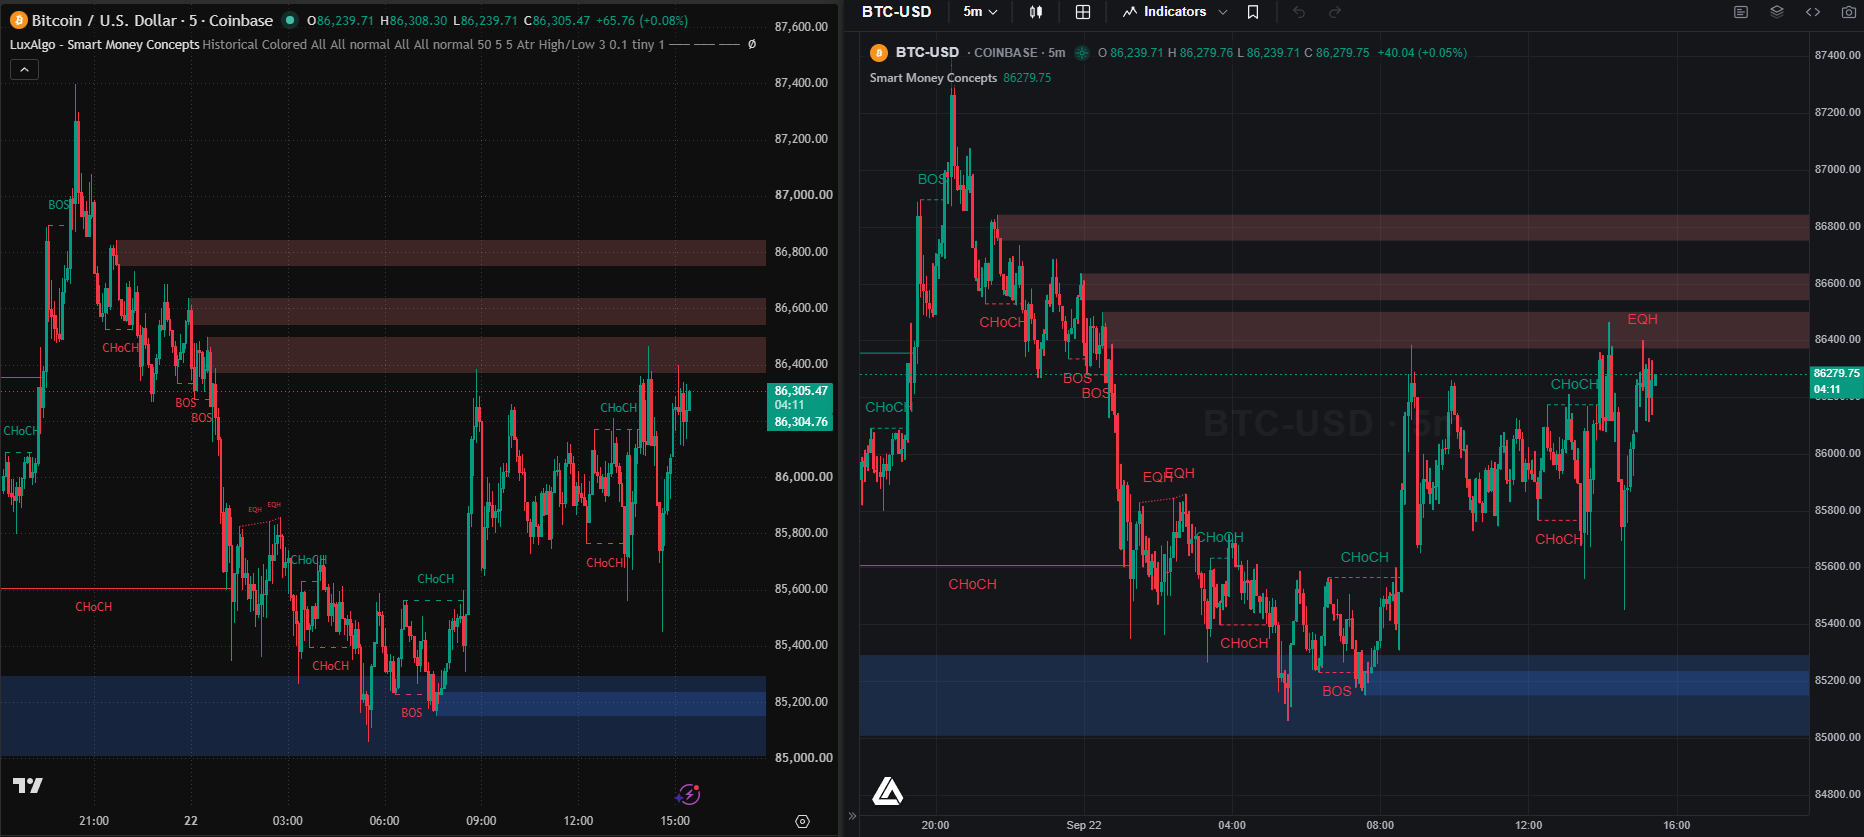
Paste the script into a LuxAlgo chart, or ask Quant to write it, and it executes through PineTS on state-of-the-art charts. This is also where the proof lives: the LuxAlgo Library, the largest indicator library in trading, holds the most popular indicators ever published on TradingView, and every one of them runs here through the same engine.
On a chart in your own app, with Vela™
Vela™ is our open-source, Apache-2.0 charting library. Register the Vela-PineTS engine and addIndicator() takes the source you wrote above. Inputs become a settings dialog; request.security() resolves through the chart’s own data feed; heavy scripts run in a Web Worker.
npm install @luxalgo/vela @luxalgo/vela-pinets pinetsimport { Vela } from '@luxalgo/vela';
import { PineWorkerEngine } from '@luxalgo/vela-pinets';
const chart = new Vela('#chart', { symbol: 'BTCUSDT', timeframe: '60', live: true })
.registerEngine('pine', new PineWorkerEngine());
chart.addIndicator(`//@version=6
indicator("Simple Moving Average", overlay=true)
length = input.int(20, "SMA Length", minval=1)
plot(ta.sma(close, length), color=color.blue, title="SMA Line")`);
// input.int becomes a settings field your users can changeIn Node.js, for bots and research
PineTS executes the script and returns plain JavaScript values, so the SMA you wrote can feed a screener across hundreds of symbols, a webhook with no alert cap, or a notebook. The coverage tables list more than 800 implemented and tested functions; native execution of unusual functions is marked experimental, so check anything exotic.
npm install pinetsimport { PineTS, Provider } from 'pinets';
// 500 daily BTC bars from the built-in Binance provider, no API key
const pine = new PineTS(Provider.Binance, 'BTCUSDT', 'D', 500);
const { result, plots } = await pine.run(`//@version=6
indicator("Configurable MA", overlay = true)
int length = input.int(20, "Length", minval = 1)
float average = ta.sma(close, length)
plot(average, "SMA")`);
console.log(result.average.at(-1)); // the latest value, as a number
console.log(Object.keys(plots)); // ["SMA"]The full walkthrough, including strategies, alerts, and bringing your own market data, is in How to Run Pine Script® Outside of TradingView.
Publishing and Optimizing Indicators
Once your script is developed and tested, the next step is to make it available to others and fine-tune its performance.
Publishing Pine Script® Code to the TradingView Library
Open the publishing control in TradingView’s Pine Editor and review the title, description, chart, visibility, and access settings before submitting. Use a title that clearly describes the script and explain its inputs, behavior, and limitations.
Start with a private publication. This allows you to review and confirm the description, code, and chart appearance before committing to a public release. Keep in mind that TradingView’s publishing workflow and moderation standards are actively maintained, so it’s worth reviewing the latest documentation before publishing publicly [3]. To maximize clarity, remove any unnecessary chart elements so your indicator remains the focal point [4].
When writing your description, stick to English for the title and provide an English version first in the description. Since the Public Library is shared globally, this improves accessibility across international versions of TradingView [4]. Your description should explain the core logic of the script. Avoid vague statements like "this script is for scalping" - instead, detail the methods or calculations involved. If your script builds on open-source code, give proper credit to the original author and ensure your adaptations offer meaningful improvements rather than just cosmetic changes.
TradingView separates publication visibility (public or private) from script access:
- Open: Code is visible to everyone.
- Protected: Code is hidden but free to use.
- By invitation: Source code is hidden and usage requires the author’s permission.
Public scripts undergo moderation, and any violation of TradingView’s House Rules or Script Publishing Rules can result in the script being hidden.
Performance Optimization Tips
The Pine Profiler in Pine Script® v6 is a useful tool for identifying performance bottlenecks [5]. It highlights which lines of code consume the most execution time on historical and real-time bars, making it easier to focus optimization efforts where they matter most.
To improve performance:
- Reduce repeated work: Profile first, then consolidate redundant requests and calculations. Preserve the data and signal timing when changing
request.security()calls. - Choose declarations for their behavior: Use
constfor compile-time constants andvarwhen state must persist across bars.varipalso persists through realtime intrabar updates; it is not an interchangeable performance shortcut, and its behavior may not be reproducible from historical bars. - Validate user inputs: Use
minval,maxval, andoptionsininput.*()functions to prevent users from entering values that could lead to errors or excessive resource usage.
After profiling, rerun the same calculation checks to confirm that an optimization has not changed the indicator’s behavior. If it becomes a strategy, validate trade rules and costs separately from code execution speed.
Testing Across Multiple Timeframes
Test the intended interval first, then a shorter and longer interval. Check initialization, missing data, session boundaries, and whether an input represents bars or elapsed time. A 20-bar SMA spans a different amount of time on a five-minute chart and a daily chart; different signals are not automatically an error.
Visualize intermediate variables to ensure multi-timeframe data updates correctly and aligns with expectations. For example, when using request.security(), plot the fetched data on your chart to confirm it behaves as intended. To avoid overwhelming the console or slowing down your script, use barstate.islast or barstate.isconfirmed to log data only on specific bars [6].
Compare realtime behavior, the value after close, and the value after reloading. Investigate differences: open-bar updates, unconfirmed higher-timeframe data, revised market data, and changes in available history can all matter. For trading simulations, use standard price bars; fills at synthetic Heikin Ashi or Renko prices can misrepresent executable prices.
Conclusion: Building Custom Indicators with Pine Script®
Pine Script® gives traders the ability to create custom indicators tailored to their specific strategies. You can combine multiple signals into one indicator and set up automated alerts to keep track of market activity without constant monitoring. TradingView’s Pine Script® ecosystem now includes tens of thousands of public scripts and extensive official documentation, giving traders a strong base to study, adapt, and build from [7].
Quant shortens the drafting and debugging loop on LuxAlgo charts. Your job is to define the rule and check that the code implements it. Start with a small indicator, compare known values, and add complexity only after the baseline behaves as intended.
Keep a saved baseline before changing logic, and retest on each platform where you plan to use the script. A visually appealing indicator or a successful compile is a starting point for evaluation, not evidence of a profitable strategy.
Key Takeaways for Traders
Let’s revisit some of the most important points for developing effective indicators:
- Start simple: Begin with basic tools like moving averages before tackling more complex systems.
- Use
input()functions: These make it easy to adjust parameters without modifying your code. - Define signal timing: Decide when a chart-bar signal may fire and how higher-timeframe values are confirmed.
- Test thoroughly: Check calculations, signal timing, and behavior on unseen data across the intervals you intend to use.
Mastering Pine Script® can be one of the most impactful skills for a trader. When paired with LuxAlgo Quant, built-in backtesting, the Library, and the support of the TradingView community, you have a practical workflow for creating, testing, and deploying indicators that can strengthen your strategy development process.
FAQs
How do I stop my indicator from repainting?
First decide whether your indicator should update during an open bar or signal only after it closes. Then check chart-bar confirmation and requested higher-timeframe data separately:
- Confirm higher-timeframe values: For a strictly higher timeframe, a common pattern is
request.security(syminfo.tickerid, higherTimeframe, close[1], lookahead=barmerge.lookahead_on). It returns the previous completed higher-timeframe close and therefore adds delay. Do not remove the offset: unoffset lookahead can leak future values into history.lookahead_offalone does not prevent realtime repainting. - Gate chart-bar signals: Use
barstate.isconfirmedwhen a signal must wait for the chart bar to close. It does not confirm a separate higher-timeframe bar. - Test thoroughly: Double-check your indicator to confirm that signals remain consistent after bars close or when you refresh the chart.
These checks improve consistency; they do not establish signal accuracy or trading profitability. TradingView’s repainting guide explains the timing tradeoffs.
When should I use request.security() for multi-timeframe data?
In Pine Script®, the request.security() function lets you pull data from other timeframes or symbols directly into your script. This is especially useful for tasks like:
- Analyzing a daily trend while working on a 15-minute chart.
- Comparing data from multiple assets within a single script.
By using this function, you can access historical or live data from different sources. This allows you to integrate broader market insights into your current analysis, giving you a more comprehensive view for making trading decisions.
What’s the fastest way to optimize a slow Pine Script®?
If your Pine Script® is running sluggishly, TradingView's performance profiling tools can help pinpoint the problem areas. Start by identifying the bottlenecks in your code. Once you know where the issues lie, focus on streamlining your calculations, cutting down on unnecessary function calls, and eliminating repetitive computations - especially in loops or on every bar. By targeting the most resource-intensive sections of your script, you can significantly boost its runtime efficiency.
Can I run my Pine Script® indicator outside TradingView?
Yes. PineTS, our open-source Pine Script® runtime, executes native v5 and v6 source on LuxAlgo charts, on Vela™ charts in your own app through the Vela-PineTS addon, and in Node.js or the browser. The indicators in this guide run unchanged on all of them; retest on each platform because data feeds and sessions can differ.
Which Pine Script® version should I write new indicators in?
v6. It has been the default for new scripts since November 2024, receives monthly updates, and is what PineTS, LuxAlgo charts and Vela™ execute natively. Keep v5 only for maintaining published scripts you do not want to migrate yet.
Do I need to learn JavaScript to run Pine Script® in my own app?
Only a few lines. The indicator stays in Pine Script®; the JavaScript is the install command, creating a Vela™ chart, and one addIndicator() call with your source as a string.
References
LuxAlgo Resources
- LuxAlgo
- LuxAlgo Blog
- LuxAlgo Library
- LuxAlgo Pricing
- LuxAlgo Quant
- Quant Introduction Documentation
- Native Indicator Guide
- Stress Testing for Trading Strategies
- Understanding Moving Averages and How Traders Use Them
- PineTS, our open-source Pine Script® runtime, and the API coverage tables
- Vela™, our open-source charting library, and scripting engines
- How to Run Pine Script® Outside of TradingView
External Resources
- TradingView
- Pine Script® User Manual
- Pine Script® Primer: First Steps
- TradingView Publishing Scripts Guide
- TradingView Script Publishing Rules
- TradingView Profiling and Optimization Guide
- TradingView Debugging Guide
- MACD Overview
- Pine Script® v6 has landed, TradingView, November 2024
- Pine Script® release notes
- Migration guide to Pine Script® v6
Pine Script® and TradingView are trademarks of TradingView, Inc. PineTS and Vela™ are independently developed by LuxAlgo and are not affiliated with or endorsed by TradingView.
Read next