Learn how to identify and trade the Inverted Hammer candlestick pattern for potential bullish reversals in downtrends.
The Inverted Hammer candlestick is a key signal for potential bullish reversals in a downtrend. It features a small body near the low of the trading range, a long upper shadow (at least twice the body length), and little to no lower shadow. This pattern suggests buyers are stepping in after sellers dominated, but it requires confirmation for trading decisions..

Quick Summary:
- What it Signals: Possible trend reversal from bearish to bullish.
- Key Features:
- Small body near the lower end of the range.
- Long upper shadow (strong buying pressure).
- No/little lower shadow (support at current price).
- Confirmation Tools:
- High volume during formation.
- RSI rising above 30.
- Bullish candle closing above the hammer’s high.
- Entry Strategy: Wait for a confirmation candle above the hammer’s high.
- Stop Loss: Below the hammer’s low.
- Profit Targets: 2x, 3x hammer length, or next resistance level.
Combine this pattern with technical indicators like RSI or moving averages for better reliability. Platforms like LuxAlgo can help identify and validate inverted hammer setups efficiently.
The Basics of the Inverted Hammer Pattern
What is an Inverted Hammer?

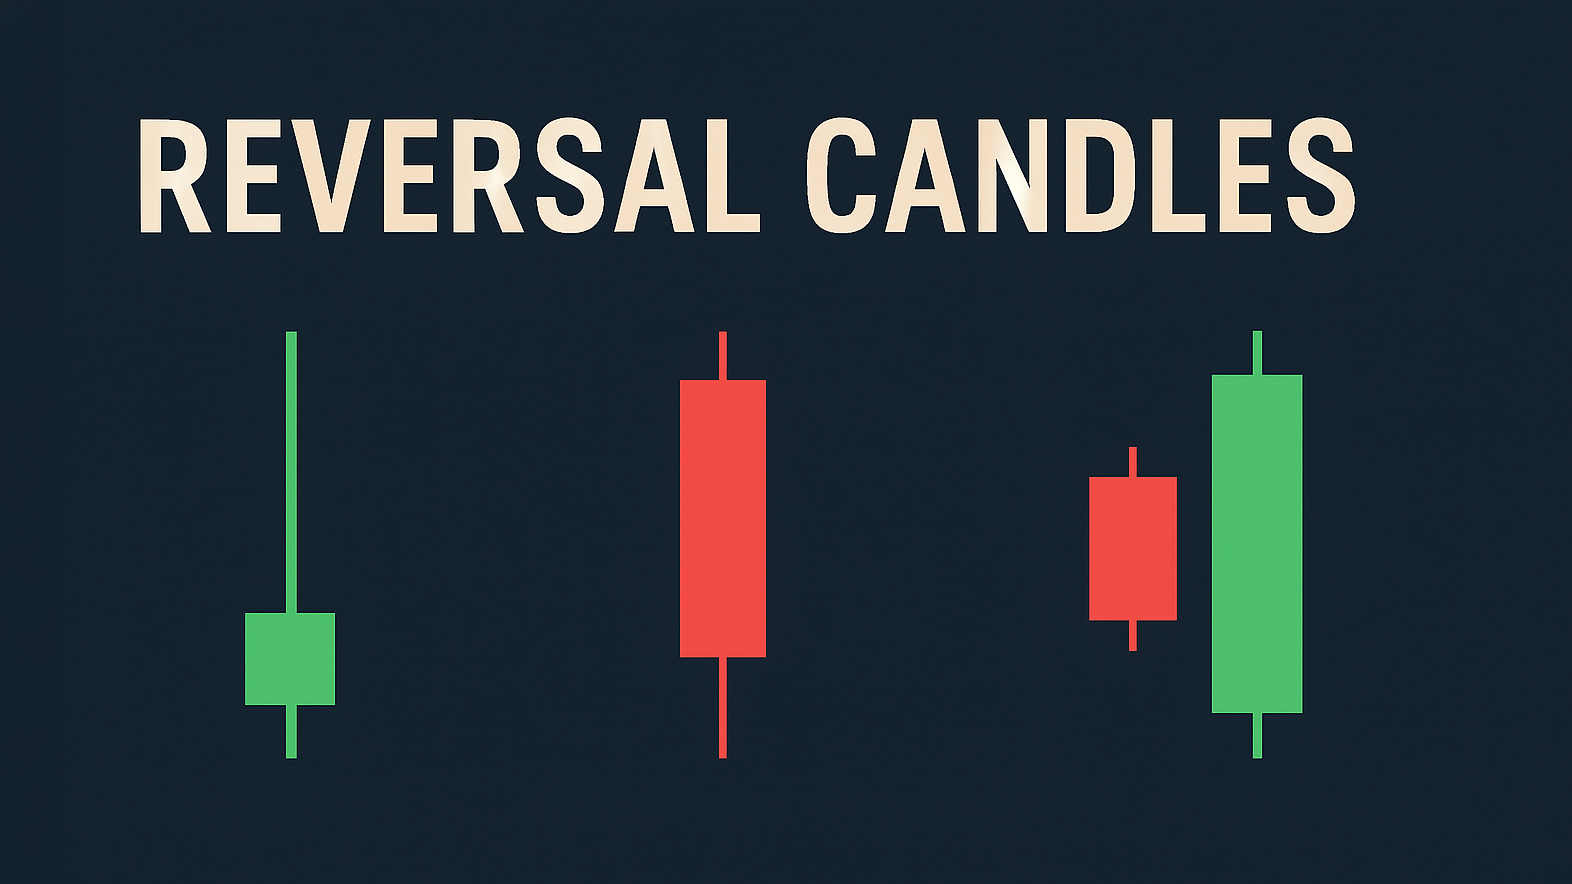
The Inverted Hammer is a single candlestick pattern with three distinct features:
- A small body near the lower end of the trading range, showing indecision as the closing price is close to the opening price.
- A long upper shadow, at least twice the length of the body, indicating strong buying pressure.
- Little to no lower shadow [1][2].
This candlestick looks like an upside-down 'T'. The long upper shadow demonstrates that buyers pushed the price higher during the session, even though it closed near the opening price [3]. The lack of a lower shadow suggests there is support at the current price level, while the small body highlights market indecision.
Why It Signals a Reversal
The Inverted Hammer can signal a possible trend reversal, particularly after a sustained downtrend, by highlighting a shift in market dynamics [1][2]. Here’s what it reflects: bears initially control the market, but bulls step in and push prices higher. Although sellers manage to bring the price back down, the strong buying pressure hints that bearish momentum might be fading [3][4].
"The Inverted Hammer signals a bullish reversal during a downtrend." - Strike Money
This pattern becomes more meaningful when it shows up at critical technical levels, such as:
- Major support zones
- Oversold conditions
- Areas with historical price significance
While the Inverted Hammer can indicate a potential reversal, it’s not a standalone buy signal [3][4]. Use confirmation tools or additional analysis to validate its implications before making trading decisions.
Confirming the Inverted Hammer Pattern
The inverted hammer pattern becomes more dependable when paired with additional confirmation signals. Here’s how traders can verify the pattern to make better trading decisions.
Checking Volume for Confirmation

Volume plays a crucial role in gauging market confidence in the inverted hammer pattern. Higher-than-average volume during the formation, especially in the upper shadow, signals strong buying interest. If this volume growth continues in the following sessions, it further supports the reversal signal.
Adding Technical Indicators

Using technical indicators can provide extra assurance. For instance, an RSI moving above 30 from oversold levels or a price breaking above a moving average can reinforce the pattern's reversal signal. Tools like Ultimate RSI and LuxAlgo’s RSI/trend indicators can simplify the process, helping traders spot and confirm inverted hammer setups more efficiently.
| Indicator | Confirmation Signal |
|---|---|
| RSI | Rising above 30 |
| Moving Averages | Price moving above the MA |
Watching the Next Candlesticks
The inverted hammer hints at a reversal, but it’s the next candlestick that confirms it. A strong bullish candlestick closing above the high of the inverted hammer provides a much clearer signal of a reversal.
Combining these confirmation methods gives traders a more reliable setup to plan their entries and exits effectively around the inverted hammer pattern.
How to Trade Using the Inverted Hammer
Entry and Exit Points
To enter a trade, wait for a confirmation candle to close above the inverted hammer's high. This signals bullish momentum. Use the table below to plan profit targets:
| Target Level | Distance from Entry |
|---|---|
| First Target | 2x hammer length |
| Second Target | 3x hammer length |
| Extended Target | Next major resistance |
Keep in mind that success rates tend to drop as you aim for farther targets.
While spotting good entry points is essential, managing risk with a proper stop loss is equally important to limit potential losses.
Setting Stop Losses
Place your stop loss just below the hammer's low. To account for market volatility, use the ATR indicator to avoid getting stopped out prematurely.
"An inverted hammer in a downtrend suggests a shift in market sentiment from bearish to bullish." - FXOpen [4]
For even better results, advanced trading tools can help refine your strategy.
Using Tools like LuxAlgo

LuxAlgo offers a range of features to make trading with the inverted hammer more efficient. With its advanced toolkit, you can:
- Analyze inverted hammer setups in various market conditions
- Confirm entry and exit rules using historical data
- Fine-tune stop loss and profit levels
Additionally, LuxAlgo's Oscillator Matrix helps verify reversal signals, making it easier to execute trades based on the inverted hammer pattern. Combining these tools with your analysis creates a well-rounded trading strategy.
Advanced Tips for Trading with the Inverted Hammer
Once you're comfortable with the basics of the inverted hammer, these advanced techniques can help you fine-tune your trading approach.
Choosing the Right Timeframe
Focus on daily and weekly charts to get more dependable inverted hammer signals. These timeframes help cut through market noise and show clearer sentiment, especially when the pattern appears near major support levels after a downtrend.
Avoiding False Signals
To steer clear of misleading signals, look for confirmation through factors like higher-than-average volume, gap-up openings, clear downtrends, and key support levels.
Tools like LuxAlgo's Price Action Concepts toolkit can make this process easier. It automatically evaluates pattern quality and market conditions, helping you filter out weaker setups. The screener feature is particularly useful for spotting high-probability inverted hammer formations while ignoring less reliable ones.
Combining with Other Patterns and Indicators
Strengthen your analysis by pairing the inverted hammer with other signals, such as RSI divergence, moving average crossovers, or volume spikes. Patterns in range-bound markets can often make inverted hammer signals more reliable.
LuxAlgo's Oscillator Matrix is another helpful tool, as it confirms reversals across various timeframes, cutting down on false signals.
Conclusion: Using the Inverted Hammer Effectively
The inverted hammer candlestick pattern is a helpful tool for spotting potential market reversals when applied correctly. Success with this pattern depends on a structured approach that includes recognizing the pattern, confirming signals, and managing risk wisely.
Identifying this pattern at the end of clear downtrends is crucial for setting up trades. Its reliability improves when it appears near major support levels, especially on daily or weekly charts where market noise is less of an issue. By focusing on these elements, traders can fine-tune their strategies to make the most of the inverted hammer.
Volume plays an important role in validating this pattern. High trading volume during the pattern's formation, combined with bullish price action and technical indicators, strengthens the reversal signal. To protect your capital, set clear stop-loss levels just below the pattern's low, allowing some flexibility for price movements.
Modern tools can make pattern validation more precise. Platforms like LuxAlgo simplify the process of identifying patterns, while features like the Oscillator Matrix offer multi-timeframe confirmation signals to support better trading decisions.
Pairing the inverted hammer with other patterns or indicators can boost its reliability. Studying historical charts under different market conditions can reveal how timeframes impact its effectiveness. Key factors to keep in mind include:
- The pattern forming at the end of a clear downtrend
- Volume behavior during its development
- How the pattern size compares to recent price movements
- Signals from technical indicators
- The overall market context and critical price levels
The inverted hammer is most effective when it's part of a broader strategy that incorporates multiple confirmation signals.
FAQs
Is the inverted hammer a bullish pattern?
Yes, the inverted hammer is considered a bullish reversal pattern, especially after a downtrend. It suggests that buyers are starting to push back, often hinting at a potential trend reversal. The candlestick's body color (green or red) isn't as important as its position and the overall market context [1][2].
What is the inverted hammer signal?
The inverted hammer signal indicates strong buying pressure during a session, hinting at a possible bullish reversal. However, confirmation is key. Look for these factors to strengthen the signal:
| Confirmation Factor | Importance |
|---|---|
| Volume | Higher volume during the pattern adds credibility. |
| Market Context | It should appear after a clear downtrend. |
| Following Candles | Bullish confirmation comes from subsequent upward price action. |
| Technical Support | Forming near key support levels boosts reliability. |
To refine your analysis, tools like LuxAlgo's pattern recognition features can help validate setups and identify promising trading opportunities.
References
- FXOpen - How to Use the Inverted Hammer Pattern
- LuxAlgo Docs: Oscillator Matrix Reversal Signals
- LuxAlgo Blog: Technical Indicators
- LuxAlgo Homepage
- Candlestick Structure - LuxAlgo
- The Lazy Trader: Inverted Hammer
- Strike Money: Inverted Hammer
- BabyPips: Inverted Hammer
- FXOpen - How to Use the Inverted Hammer Pattern (2nd reference)
- LuxAlgo Blog: Reversal Spotting Made Easy
- LuxAlgo: Liquidation Levels
- LuxAlgo Blog: Trading Strategies
- Image: LuxAlgo screenshot
- Image: Inverted Hammer Candlestick (Intro)
- Image: Inverted Hammer Explanation
- Image: Checking Volume for Confirmation
- Image: Adding Technical Indicators
- LuxAlgo: Ultimate RSI


