
Enhance your trading with advanced RSI techniques for better market analysis, signal confirmation, and improved decision-making.
The Relative Strength Index (RSI) is a popular tool for traders to measure market momentum and identify potential reversals. This guide explains advanced strategies to improve your RSI analysis, including:
- Custom RSI thresholds for different market conditions (e.g., trending vs. range-bound).
- Divergence analysis to spot early trend reversals.
- Multi-timeframe strategies for better signal confirmation.
- Market-specific adjustments to fine-tune RSI settings for various trading instruments.
Key Takeaways:
- Adjust RSI settings (e.g., periods and thresholds) based on market behavior to improve accuracy by 15–20%.
- Use shorter RSI periods (5–9) for volatile markets and longer periods (21–30) for stable ones.
- Combine RSI with price levels, divergence analysis, and multi-timeframe approaches for better results.
For example, in a strong trend, a 14–21 RSI with 80/20 levels works well, while range-bound markets benefit from a 9–14 RSI with 70/30 levels. Tools like LuxAlgo’s Oscillator Matrix and AI Backtesting Assistant can further refine your strategies by providing real-time insights and historical analysis.
RSI Settings and Customization
Standard RSI Settings
The default 14-period RSI with 70/30 overbought and oversold levels is often the go-to choice for traders. While this setup works well in range-bound markets, it can lag in trending conditions, missing critical momentum changes. Adjusting these settings to align with specific market conditions can improve accuracy.
Adjusting RSI for Market Conditions
Fine-tuning RSI settings based on market behavior can lead to better trading outcomes. In fact, making adjustments to match the market’s dynamics can improve trade accuracy by 15–20%.
Here’s a quick guide to optimal RSI settings for different market scenarios:
| Market Condition | RSI Period | Overbought/Oversold Levels |
|---|---|---|
| Strong Trend | 14–21 | 80/20 |
| Range-Bound | 9–14 | 70/30 |
| High Volatility | 5–9 | 80/20 |
| Low Volatility | 21–30 | 65/35 |
For day traders, shorter periods like 5–7 can provide quicker signals, while swing traders may prefer longer periods, such as 14–21, to filter out noise.
RSI Adjustments for Volatile Markets
When trading in volatile environments, consider these setups:
- Scalping: Use a 5–7 period RSI with 80/20 levels for fast momentum trades.
- Momentum Trading: A 9–12 period RSI can help confirm trends during active markets.
- Range Trading: A 14–25 period RSI with adjusted 40/60 levels can generate more frequent signals.
In more stable, traditional markets, a longer 21–30 period with 65/35 levels can help reduce false signals while capturing trends more effectively.
Advanced RSI Techniques
Custom RSI Threshold Settings
Fine-tune your RSI thresholds by analyzing historical market trends instead of sticking to the default 70/30 levels. Adjust both the RSI period and thresholds to align with specific market conditions, which can improve trade accuracy by 15–20%.
To get the best results, study market behavior across different timeframes and observe RSI patterns during major reversals. Use previous settings tailored to trending, range-bound, or volatile markets as a reference. Once you’ve established custom thresholds, incorporate multiple timeframes to sharpen your entry and exit points.
RSI Multi-Indicator Strategy
Combine RSI with a multi-timeframe approach to enhance your strategy. Use higher timeframes to identify trends and shorter ones for precise entries and exits. For example:
| Timeframe | Purpose | RSI Analysis |
|---|---|---|
| Daily | Identify trend | Above or below 50 shows bias |
| 4-Hour | Spot setups | Watch for reversals at 30/70 |
| 1-Hour | Time entries | Confirm momentum direction |
This layered approach strengthens your decision-making. Adding divergence analysis can provide even more confirmation.
RSI Divergence Trading
By comparing price action with RSI patterns, you can improve timing and manage risk effectively. Backtesting on forex pairs has shown RSI divergence strategies to achieve a 55–65% success rate over time.
| Characteristic | Bullish Divergence | Bearish Divergence |
|---|---|---|
| Price Action | Lower lows | Higher highs |
| RSI Pattern | Higher lows | Lower highs |
| Best Market Condition | Oversold (RSI < 30) | Overbought (RSI > 70) |
| Confirmation Signals | Support breakout, increased volume | Resistance breakdown, decreased volume |
| Risk Level | Lower in downtrends | Higher in uptrends |
Divergence adds an extra layer of precision, especially in volatile markets.
RSI with Price Levels
Pair RSI readings with key price levels to make more accurate trade decisions:
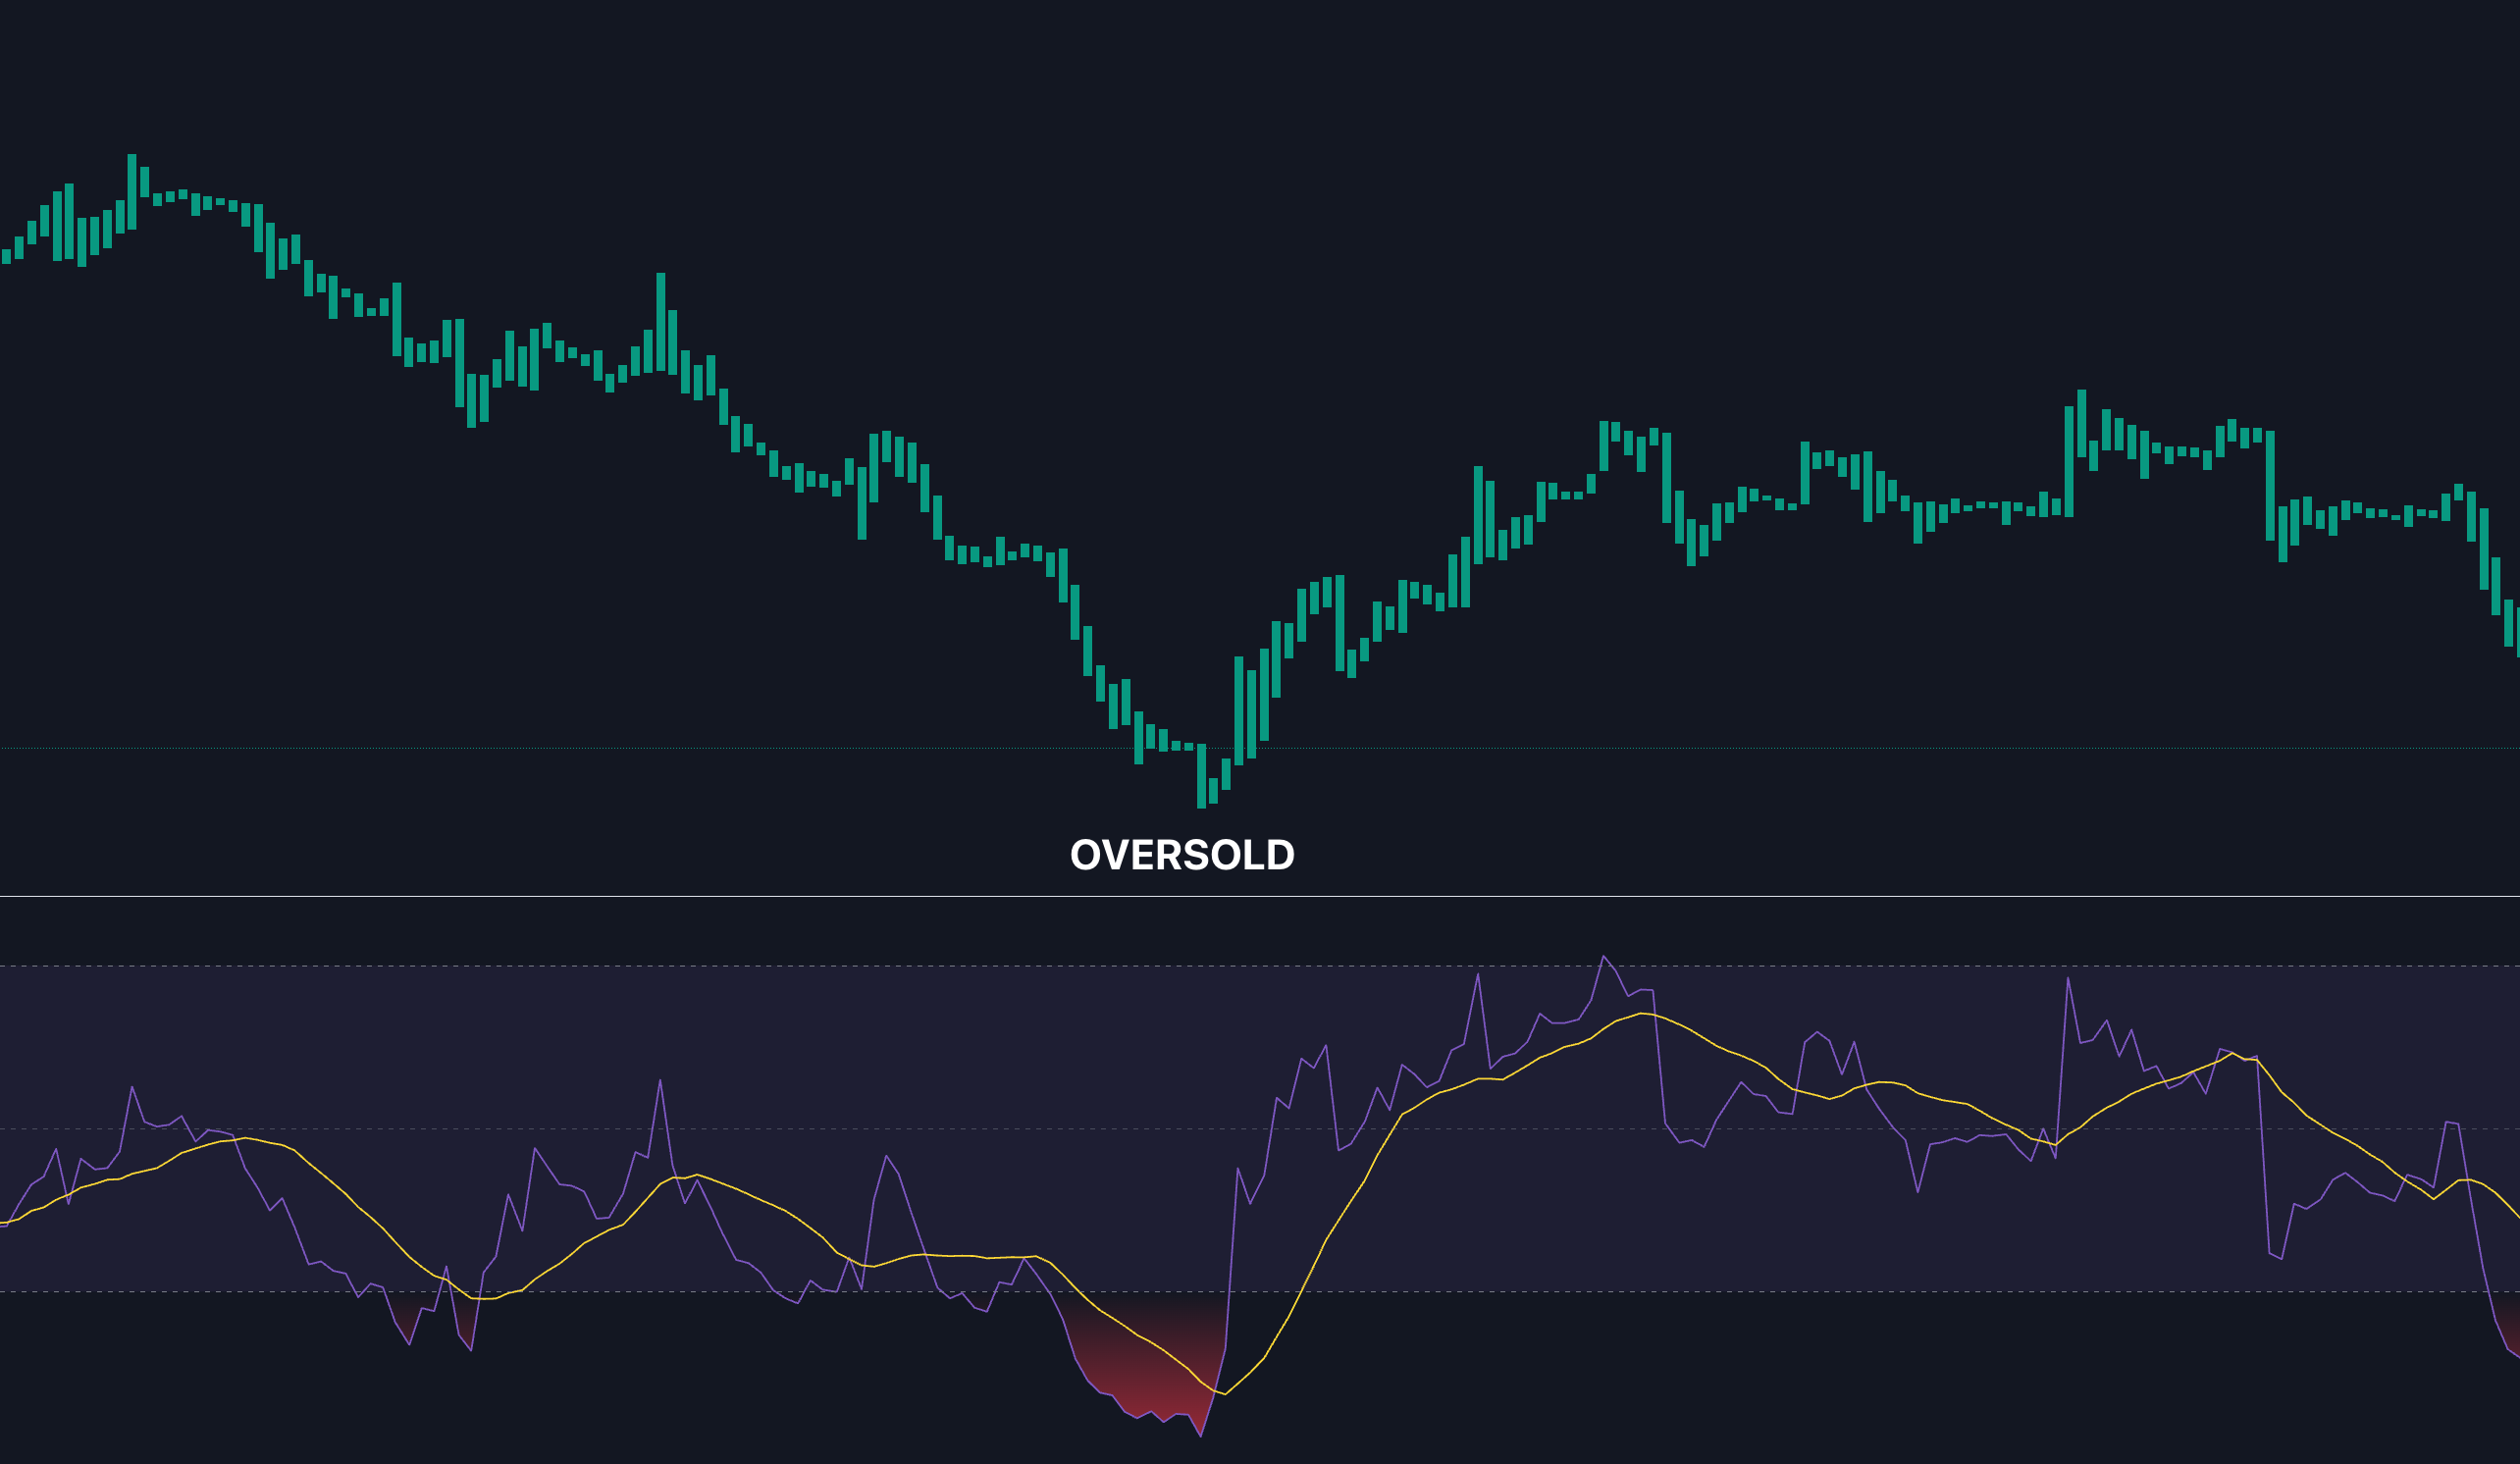
- RSI below 30 near support may hint at a reversal.
- RSI above 70 at resistance could signal trend exhaustion.
- RSI staying above 40 in an uptrend or below 60 in a downtrend confirms trend strength.
To maximize this strategy, adjust RSI settings based on market conditions:
- Use shorter periods (5–9) for high-volatility markets.
- Opt for longer periods (21–30) in low-volatility environments.
- Apply dynamic thresholds that adapt to shifting market phases.
These adjustments can significantly enhance your trading precision and adaptability.
Master the RSI Indicator (ULTIMATE In-Depth Guide)
LuxAlgo Ultimate RSI Indicator
The Ultimate RSI is a free, next-generation RSI implementation available in the LuxAlgo Library. Designed to address the limitations of the traditional 14-period RSI, it combines multiple RSI-based calculations and advanced smoothing techniques to deliver clearer momentum signals across any market.
Key Features
- Multi-Length Engine – Aggregates several RSI periods into a single line, reducing noise while preserving responsiveness.
- Adaptive Thresholds – Dynamic overbought/oversold levels that expand in trending markets and contract in consolidations, improving timing during regime shifts.
- Trend Bias Overlay – Background shading highlights bullish or bearish momentum when the Ultimate RSI remains above 50 or below 50 for an extended period.
- Automatic Divergence Detection – Optional plots flag bullish and bearish divergences in real time for additional confirmation.
- Customization – Traders can fine-tune smoothing methods, period groupings, and alert conditions directly in the settings or via Pinescript inputs.
How to Use It
- Add the indicator – Search “LuxAlgo Ultimate RSI” in the TradingView indicator menu. View the default template here.
- Select Market Regime – Enable “Adaptive Thresholds” to let the indicator widen or narrow its 70/30 style bands automatically.
- Confirm Signals – Combine Ultimate RSI crosses with divergence flags or price-action zones for higher-probability entries.
- Backtest – Use LuxAlgo’s AI Backtesting Assistant to test different period groups, threshold behaviors, and divergence rules over historical data.
For advanced RSI enthusiasts, LuxAlgo also offers several other RSI adaptations such as Stochastic RSI overlays, Triple-Smoothed RSI, and a Volume-Weighted RSI. Each implementation serves a different purpose, enabling traders to tailor momentum analysis to their strategy.
RSI Best Practices
Regular RSI Testing
Frequently evaluate and fine-tune your RSI strategy to adapt to different market conditions. Focus on testing RSI performance across multiple timeframes to better understand market behavior.
| Timeframe | Testing Focus | Key Metrics |
|---|---|---|
| Daily | Identifying trends | RSI above or below 50 |
| 4-Hour | Assessing setups | Reversal patterns at 30/70 |
| 1-Hour | Timing entries | Momentum confirmation |
Add volume analysis to your tests. High volume during RSI reversals can indicate stronger, more reliable setups. Adjusting RSI settings based on these insights has been shown to improve accuracy by 15–20%. Use these findings to tweak your RSI approach for various market scenarios.
RSI Market Adjustments
When modifying RSI settings, incorporate the 14-period Average True Range (ATR) to determine stop-loss levels. This ensures consistent risk management, regardless of market fluctuations.
Data Standards
High-quality data is essential for building a trustworthy RSI strategy. Pay attention to these critical points:
- Match RSI signals with actual price movements for validation.
- Confirm potential reversals by analyzing volume.
- Use complementary indicators like moving averages or MACD to filter out misleading signals.
For backtesting, rely on historical data adjusted for:
- Stock splits
- Dividend payouts
- Trading costs
- Execution slippage
- Market gaps
Accurate data ensures your backtesting results reflect real-world trading conditions.
Conclusion
Strategy Summary
Mastering RSI involves tweaking technical settings and tailoring them to specific market conditions. Here’s how different trading styles align with RSI settings:
| Trading Style | RSI Period | Threshold Levels | Usage |
|---|---|---|---|
| Day Trading | 5-9 | 80/20 | Captures quick momentum shifts |
| Swing Trading | 14-21 | 70/30 | Focuses on intermediate trends |
| Position Trading | 21-30 | 65/35 | Targets long-term movements |
These adjustments can enhance trade accuracy by an estimated 15–20%. The next step? Apply these methods with a clear setup process.
Implementation Steps
-
Set Base RSI Parameters
Adjust your RSI settings to align with the current market. Tools like the LuxAlgo Oscillator Matrix can help identify the most effective parameters for your trading environment. -
Set Validation Rules
Build a confirmation system by incorporating:- Candlestick patterns to validate price action
- Volume analysis to assess potential reversals
- ATR-based stop-loss levels for risk management
- Multi-timeframe analysis (e.g., daily for trend, 4-hour for setup, 1-hour for entry)
-
Optimize Strategy
Use LuxAlgo’s AI Backtesting Assistant to refine your approach:- Test your strategy under various market conditions
- Adjust parameters based on historical data
- Track performance metrics like win rates and drawdowns, updating settings as needed
FAQs
How can I adjust RSI thresholds to better match different market conditions?
To enhance trading accuracy, you can adjust RSI thresholds based on market conditions. For strong trends or highly volatile markets, consider using thresholds like 80/20 to better capture overbought and oversold levels. In contrast, for range-bound or less volatile markets, 70/30 thresholds may be more effective.
Customizing RSI settings to align with market behavior allows you to identify signals more accurately, improving decision-making and potentially increasing the effectiveness of your trades.
How can using multi-timeframe strategies improve RSI analysis and confirm trading signals?
Using multi-timeframe strategies in RSI analysis allows traders to gain a clearer picture of market momentum and reduce the likelihood of false signals. By analyzing multiple timeframes, you can align your trading decisions with the overall trend while fine-tuning entries and exits.
For example, the daily chart can help identify the broader trend, a 4-hour chart is useful for spotting potential setups, and a 1-hour chart can confirm momentum and pinpoint precise entry or exit points. This layered approach enhances signal reliability and improves decision-making in various market conditions.
How can RSI divergence analysis help spot trend reversals, and what are the best ways to use it effectively?
RSI divergence analysis can be a powerful tool for identifying potential trend reversals by comparing price movements with the RSI indicator. A bullish divergence occurs when the price makes lower lows while the RSI forms higher lows, signaling a possible upward reversal, especially in oversold conditions (RSI < 30). Conversely, a bearish divergence happens when the price makes higher highs while the RSI creates lower highs, indicating a potential downward reversal, particularly in overbought conditions (RSI > 70).
To use this technique effectively, combine divergence analysis with other tools like candlestick patterns, volume analysis, or moving averages to confirm signals and reduce false positives. For bullish divergence, look for bullish candlestick patterns, stronger trading volume, or the RSI crossing above 30. For bearish divergence, watch for bearish candlestick patterns, declining volume during price increases, or price approaching key resistance levels. These steps can help improve accuracy and make better trading decisions.
References
- Relative Strength Index – Investopedia
- LuxAlgo – Key to Understanding RSI
- LuxAlgo – Best Indicator Settings & Timeframes
- Oscillator Matrix – Toolkit Introduction
- LuxAlgo – AI Backtesting Assistant
- LuxAlgo – Ultimate RSI Documentation
- TradingView – Ultimate RSI Template
- LuxAlgo – Other RSI Implementations (X/Twitter)


