Stop-Loss and Take-Profit: Setting Your Limits
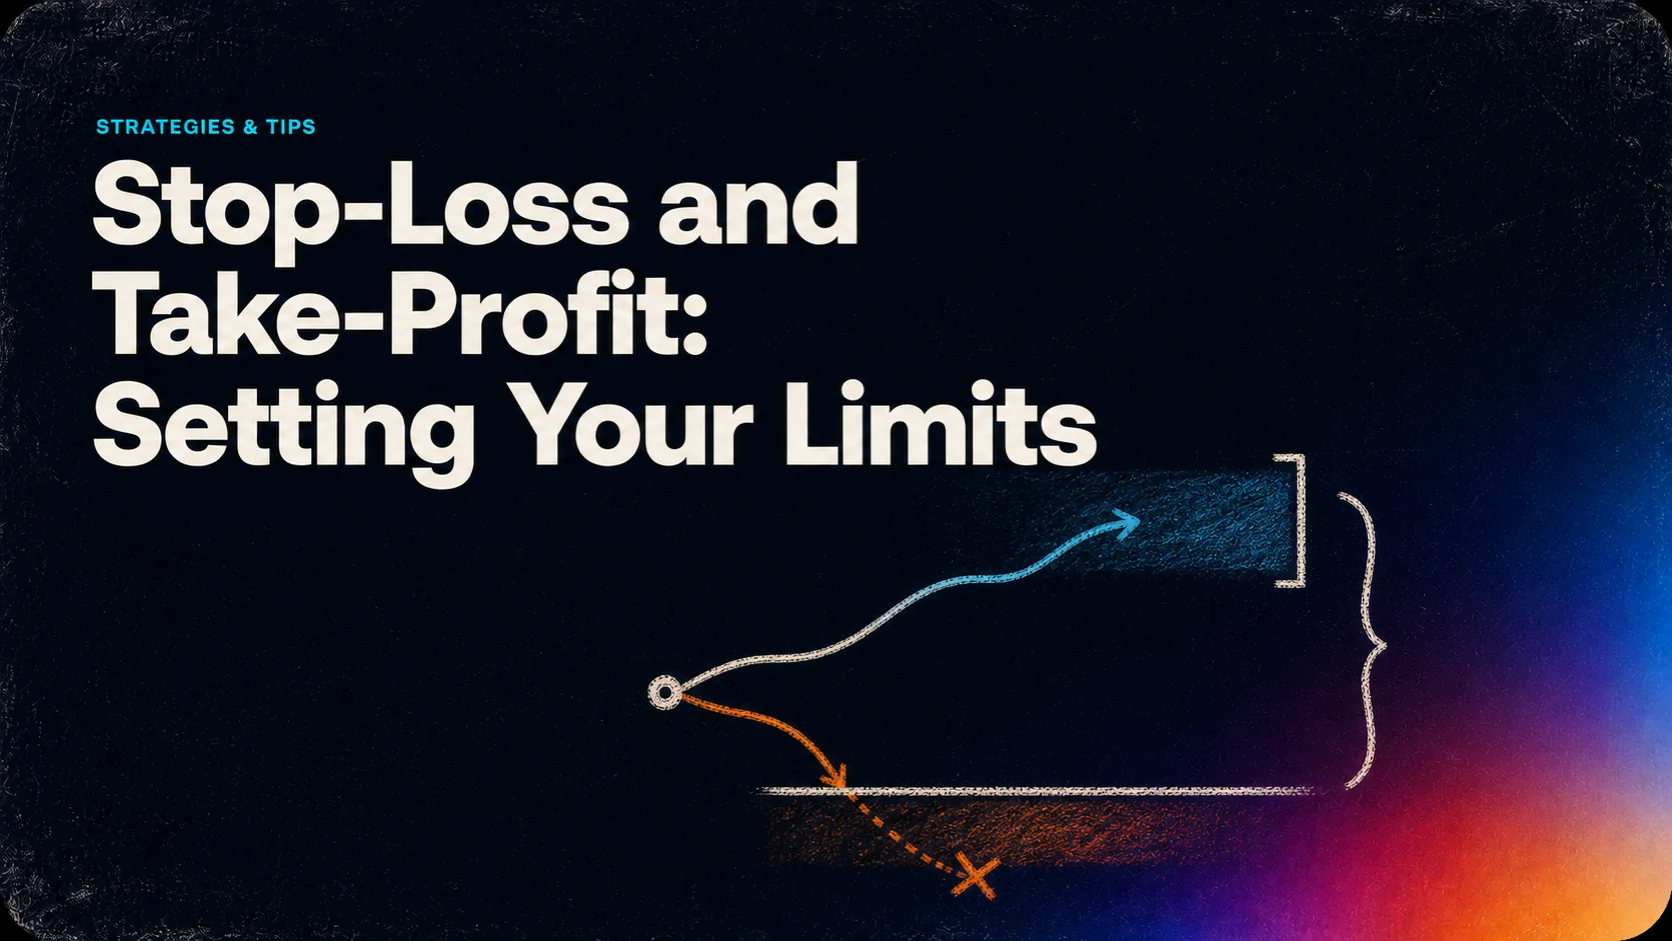
Stop-loss and take-profit orders turn an exit plan into instructions for handling a position. A stop is intended to exit after an adverse move; a take-profit instruction aims to exit at a favorable target. Their actual behavior depends on the order type, broker, and market.
These tools can reduce the need to make every exit decision in the moment, but they do not guarantee a maximum loss or a profitable trade. Plan the levels, calculate position size, and test the complete rule. Together, our charting platform, Vela, and Quant provide a workflow for reviewing exit ideas and their historical results.
Stop-Loss and Take-Profit Basics
Stop-Loss Orders Explained
A stock sell stop below the current price becomes a market order when triggered. Its execution price can differ from the stop. For a hypothetical $20 entry and $18 stop, the planned price risk is $2 per share, but a gap or poor liquidity can produce a larger loss. A buy stop can be used to exit a short position after an adverse rise.
A stop-limit becomes a limit order when triggered. It controls the worst permitted execution price, but can remain unfilled. Brokers may use different trigger conventions, such as last-trade or quotation prices. The SEC’s stop-order bulletin explains these distinctions.
Take-Profit Orders Explained
For a long stock position, a take-profit exit is often implemented with a sell limit above entry. A sell limit executes at its price or higher if it fills. For a short position, a buy limit below entry can serve the corresponding purpose. See the SEC’s limit-order definition.
A target being touched on a chart does not prove your whole order filled. Check the platform’s take-profit implementation, session rules, liquidity, and remaining quantity. Other instruments or platforms may implement conditional exits differently.
Benefits of Planning Exits
- Clear decisions: define where the trade thesis fails and when profits will be taken.
- Measurable risk: connect the stop distance to position size and the account’s risk budget.
- Consistent review: compare intended exits with actual fills instead of judging only the final profit.
- Less manual intervention: properly configured orders can execute without a fresh decision, while still requiring oversight.
Setting Stop-Loss and Take-Profit Levels
Technical Analysis Methods
Begin with the setup and timeframe. A stop beyond a relevant swing level answers a different question from a fixed percentage or volatility-based stop. Define why the level invalidates the trade, then check whether the required quantity fits the risk budget.
| Method | How it can define an exit | What to check |
|---|---|---|
| Market structure | Place a planned exit relative to a specified swing or range boundary | The level must have been identifiable at the decision time |
| ATR-based | Use a multiple of measured volatility as the distance | Period, timeframe, frozen or changing ATR, and position size |
| Trailing rule | Move the exit reference as price advances | Update timing and whether the stop is allowed to loosen |
| Range or channel | Use an explicitly defined band or channel boundary | A breakout can invalidate a range assumption; no boundary guarantees a reversal |
ATR, Parabolic SAR, Bollinger Bands, Donchian Channels, and Chandelier Exit offer different ways to describe price behavior. None is universally best for a market regime. A plotted indicator line is also not automatically a working broker order. For the distinction between a changing ATR line and a stop that only tightens, see ATR stop-loss methods.
Risk-Reward Calculations
For a simple long trade, planned risk per share is entry minus stop; planned reward is target minus entry. An illustrative $100 entry, $95 stop, and $115 target gives $5 risk and $15 reward: 1:3 risk-to-reward, before costs. A 15% target and 5% stop produce that same planned ratio, not proof that either level is suitable.
A 50-pip stop with a 100-pip target is instead 1:2. If every realized win is twice each realized loss and there are no costs or scratch trades, the break-even win rate is 33⅓%. Costs raise that threshold. A more distant target may also lower the frequency of winning trades, so assess actual outcomes using win rate and realized expectancy.
Size the trade after choosing a meaningful stop. With an illustrative $250 planned-loss budget and $5 risk per share, 50 shares use the entire budget before costs. Fees, slippage allowances, and capital limits can require fewer shares. Read the position-sizing guide for those constraints.
Adjusting for Market Conditions
Higher measured volatility may justify testing a wider stop, a smaller position, or staying out. It does not automatically justify widening an existing trade’s loss allowance. At unchanged quantity, increasing a stop from 30 to 80 pips increases planned price risk by about 2.67 times.
Specify adjustments before entry where possible. If the rule changes after news or a break of support, recalculate total exposure and record the reason. Repeatedly moving the stop away simply to avoid taking a loss defeats the original budget.
Stop-Loss and Take-Profit Mistakes
- Choosing distance from the desired profit: forcing a tight stop solely to display a large ratio can make ordinary price movement trigger exits.
- Assuming wider is safer: a wider stop increases potential monetary loss unless size or another constraint changes.
- Confusing a target with a fill: inspect actual executions, especially around gaps, illiquid periods, and partial fills.
- Leaving exit quantities unchanged: after scaling out, reconcile outstanding orders with the remaining position. Where supported, verify the platform’s linked-order cancellation behavior.
- Changing rules impulsively: document the original plan, review deviations, and pause when you cannot follow the chosen process.
Where to Place Your Stop Loss and Take Profit Tutorial
The Moving Average demonstrates stop and target placement. Use the examples to examine a method, and apply the order-type and execution distinctions above when implementing it.
Trading Exit Tools and Automation
Plan and Test with LuxAlgo
LuxAlgo combines Vela with AI-assisted strategy development. Mark reference levels using chart drawings, then describe the entry, stop, target, and position-sizing rules to Quant. State whether distances are prices, percentages, ticks, or ATR multiples so the generated code uses the intended units.
In the Quant strategy workflow, review Code and click Run. Define fixed versus trailing exits, when updates occur, and how partial exits affect the remainder. Use Inputs for exposed parameters and ask Quant when changing the logic.
Check the native backtest results with realistic costs and sizing. Inspect examples where both stop and target lie within a bar’s range: the available data and fill model determine what sequence can be inferred. Historical simulation is not a guarantee of live execution.
Keep Platform Workflows Distinct
Keep three steps separate: an indicator plots a level, an alert reports a condition, and an execution system submits an order. Confirm which steps are actually configured. A saved backtest or a line drawn on a chart does not establish that a broker is protecting the position.
Verify Automation Before Relying on It
Automation can make a defined process more consistent, but it can also repeat a configuration error. Test order direction, quantity, units, trigger timing, cancellations, and partial fills in a demo environment. Confirm where the instructions run and how interruptions or rejected orders are reported.
Compare intended exits with the actual record in the Journal or the relevant broker report. Orders still need monitoring, and demo results do not establish live fill quality.
Putting Your Exit Plan to Work
Choose levels that match a defined setup, size the position around the planned risk, and understand the order type used to implement each exit. Test the complete sequence, including unfavorable paths, before relying on an attractive risk-reward ratio.
Use Vela and Quant to investigate the rules, then review actual fills and costs. The purpose of an exit plan is to make decisions explicit and reviewable while accounting for how markets and orders really behave.
Read next