
Learn how to use the ADX Breakout Indicator to identify market entry points by leveraging trend strength for more reliable breakout trading.
The Rob Booker ADX Breakout Indicator is a trading approach that combines the Average Directional Index (ADX) with breakout techniques to identify precise market entry points. By focusing on trend strength rather than direction, it helps traders filter out weak signals and spot moments when markets are likely to break out of consolidation phases.
Key Takeaways:
- ADX Basics: Measures trend strength on a 0-100 scale. Values above 25 indicate strong trends; below 25 suggests weak or sideways markets.
- Breakout Confirmation: Combines price breakout with rising ADX (above 25) for better timing and reduced false signals.
- Entry Signals: Triggered when ADX rises from below 20 to above 25, paired with directional confirmation (+DI for bullish, -DI for bearish).
- Risk Management: Stop-loss placed near breakout box boundaries; profit targets set using multiples of the box height.
- LuxAlgo Integration: LuxAlgo provides backtesting, real-time alerts, and volume confirmation on TradingView.
This indicator is suited for various timeframes and asset classes, offering a systematic way to trade breakouts with reduced uncertainty.
MTF ADX Pattern: How to Use ADX to Anticipate a Breakout
Understanding the Average Directional Index (ADX)
The Average Directional Index (ADX) is designed to measure the strength of a trend, without focusing on its direction. Created by J. Welles Wilder Jr. in 1978, the ADX has become a key part of technical analysis, especially for traders looking to assess the intensity of price movements.
Unlike indicators like moving averages that aim to predict price direction, the ADX zeroes in on how strong the price movement is. This makes it particularly useful for breakout trading, where distinguishing between real and false breakouts can make or break a trading strategy. For a primer on the calculation and interpretation, see this overview of the Average Directional Index.
Typically, the ADX uses a 14-period setting and generates a single line that ranges from 0 to 100. This straightforward approach makes it easier for traders to gauge market momentum and apply it to breakout strategies effectively.
ADX Components Explained
The ADX framework relies on three key lines that work together to provide a comprehensive look at market trends:
- The ADX line: The main feature of the system, it represents the overall strength of a trend, regardless of whether it's moving up or down. It’s calculated through a smoothed formula that helps cut through market noise.
- +DI (Positive Directional Indicator): This measures the strength of upward movements. When the +DI line is climbing and stays above the -DI line, it indicates buyers are driving the market.
- -DI (Negative Directional Indicator): This tracks the strength of downward movements. A rising -DI line that overtakes the +DI line signals increased selling pressure.
By analyzing the relationship between these three lines, traders get a clearer picture of market dynamics. For example, a rising ADX line paired with a dominant +DI or -DI suggests a strong directional trend is in play.
Reading ADX Values
Understanding how to interpret ADX values is key for successful breakout trading. The indicator’s scale, ranging from 0 to 100, can be broken into key zones:
- Above 25: Indicates a strong trend, giving traders more confidence when deciding to enter a trade.
- Above 40: Reflects a very strong trend, though it might also suggest the trend is nearing an overextended state. This could be a signal for some traders to consider exiting rather than entering.
A sharp increase in the ADX (e.g., from below 20 to above 25) often points to a high potential for a breakout. On the other hand, a slow rise might suggest weakening momentum.
Market conditions also influence ADX behavior. In highly volatile markets, the ADX tends to move quickly and reach extreme levels, while in calmer markets, its changes are more gradual. Recognizing these patterns can help traders fine-tune their strategies.
Using ADX to Spot Breakout Opportunities
The ADX serves as a valuable filter for identifying genuine breakouts and avoiding false signals by confirming momentum:
- Before the Breakout: Look for an ADX reading below 20 during periods of consolidation near key levels.
- Confirming the Breakout: Wait for the ADX to rise above 25 and check that the dominant DI aligns with the price movement. For upward breakouts, a rising +DI above the -DI supports a bullish scenario. For downward breakouts, a dominant -DI confirms bearish momentum.
- Avoiding False Signals: Entering a trade only after the ADX exceeds 25 helps reduce the risk of falling for false breakouts. If the price moves but the ADX remains below 25, the momentum might be insufficient, increasing the chance of a reversal.
- Timing the Entry: While the ADX may lag slightly as it confirms momentum, this delay can allow traders to enter trades at more favorable prices once the breakout is validated.
How the Rob Booker ADX Breakout Indicator Creates Entry Signals
This approach blends momentum analysis with visual breakout zones to generate entry signals. By combining the ADX’s ability to confirm trends with breakout identification, the method aims to pinpoint trades with strong potential. The workflow focuses on finding consolidation zones, waiting for price to break out, and ensuring the ADX confirms momentum. This dual-layered strategy minimizes the risk of entering weak breakouts that lack follow-through.
Identifying Consolidation and Breakout Zones
The indicator highlights consolidation periods to locate breakout opportunities. It draws a "breakout box" around price action that remains within a narrow range for 10–20 bars. The box’s boundaries represent the highest high and lowest low during the consolidation phase.
These zones are especially effective when they appear after notable price moves or near critical technical levels. For instance, a consolidation box just below a previous all-time high often signals a stronger breakout potential compared to random sideways movement.
Tighter consolidation ranges generally lead to more dynamic breakouts, as the compressed price action builds energy that gets unleashed during the breakout. On the other hand, wider consolidation ranges might indicate weaker momentum, resulting in less reliable signals.
Using ADX to Confirm Entries
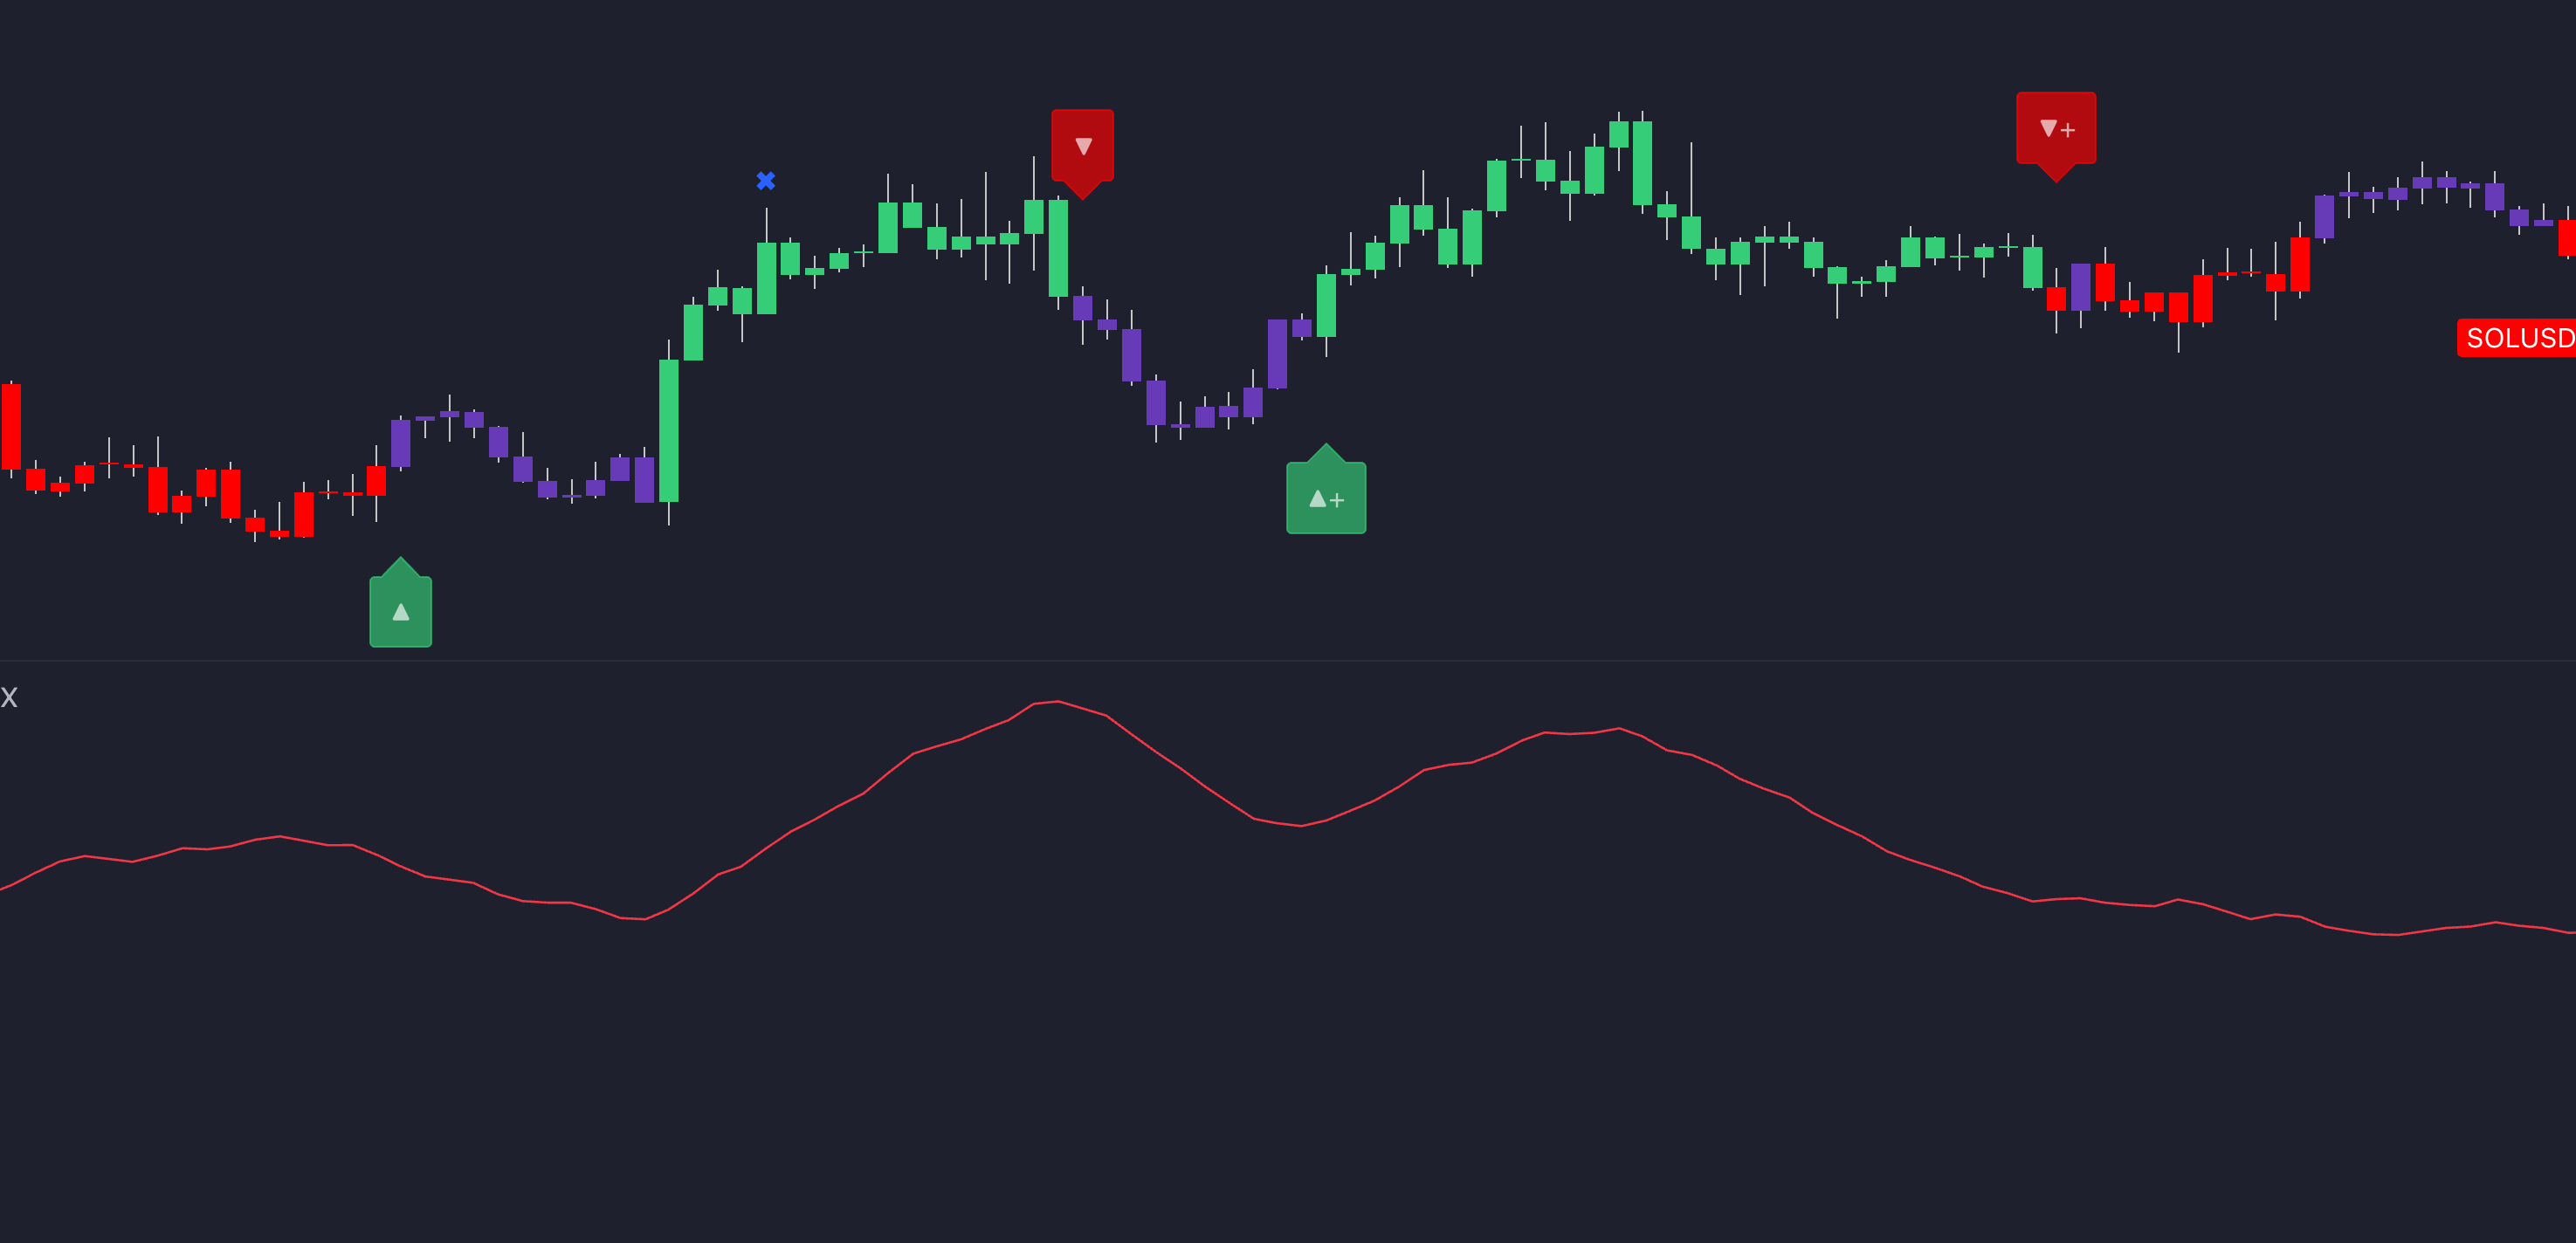
Once the price breaks out of the consolidation box, the ADX is used to confirm the strength of the move. Valid entry signals occur when the ADX rises above 25, and the directional indicators (DI) align with the breakout direction — +DI for bullish moves and −DI for bearish ones. For a DI-based workflow on TradingView, see the Oscillator Matrix overview.
A rapid ADX surge from below 20 to above 25 within a few bars often signals a high-probability breakout. For bullish breakouts, the +DI must cross above the −DI line, while for bearish breakouts, the −DI should surpass the +DI.
Entry signals typically appear 1–3 bars after the breakout, allowing the ADX to respond to the momentum shift. This slight delay helps weed out false breakouts where prices temporarily move beyond the consolidation range but fail to sustain the trend.
While ADX readings above 30 add confidence to the signal, extremely high values (above 50) may suggest the move is overextended, requiring careful position sizing.
Setting Stop-Loss and Take-Profit Levels
After confirming the entry with the ADX, managing risk becomes essential. A practical approach is to use the dimensions of the breakout box and ADX readings to guide stops and targets.
-
Stop-Loss Placement:
For bullish breakouts, place the stop-loss slightly below the lower boundary of the box. For bearish breakouts, position it just above the upper boundary.
In volatile markets, consider setting stops 10–15% of the box height from the boundary to account for price fluctuations. In calmer conditions, tighter stops of 5–10% are more effective. -
Take-Profit Targets:
Use multiples of the breakout box height to set profit targets. A conservative approach targets the box height measured from the breakout point. For stronger momentum (evidenced by higher ADX readings), aim for 1.5–2× the box height.
When the ADX climbs above 35 and continues rising, extended targets of 2–3× the box height may be achievable. Conversely, when the ADX barely clears 25, sticking to conservative targets can help secure profits before momentum wanes.
To balance risk and reward, partial profit-taking can be effective. For example, close half the position at the first target and allow the rest to run toward extended targets. This strategy ensures that gains are locked in while still taking advantage of potential larger moves.
Improving ADX Breakout Strategies with LuxAlgo Tools
LuxAlgo provides TradingView-ready tools that take the ADX breakout approach to the next level by adding advanced confirmations, backtesting capabilities, and automation. While the Rob Booker ADX Breakout concept provides reliable entry signals, integrating LuxAlgo’s features enhances the effectiveness of these strategies. These capabilities bring additional layers of validation, streamline the testing process, and provide automated alerts — creating a well-rounded trading framework that reduces false signals and supports disciplined execution.
Using LuxAlgo’s Signals & Overlays Toolkit
The Signals & Overlays (S&O) Toolkit works seamlessly with ADX breakout strategies by offering a variety of signal algorithms to confirm or filter potential entry points. For instance, when a breakout occurs, the S&O Toolkit’s trend-following components can help verify the setup before committing to a trade.
The Multi-Timeframe Analysis feature strengthens this approach by ensuring alignment with broader market trends. A breakout spotted on a 15-minute chart, for example, can be cross-checked against hourly or daily charts. This extra step helps avoid counter-trend breakouts and increases confidence in entries.
Adding volume confirmation improves reliability. When ADX readings climb above 25 and alerts confirm rising participation, the chances of a sustained breakout increase.
Testing Breakout Strategies with LuxAlgo
After identifying potential entries, LuxAlgo enables traders to refine their methods with comprehensive backtesting. The AI Backtesting Assistant and its documentation use historical market data to evaluate how ADX strategies perform under different conditions, offering insights that go far beyond manual testing or guesswork.
Backtesting can fine-tune strategies by identifying optimal ADX settings for various asset classes. For instance, while the standard ADX threshold of 25 might work well for forex pairs, tests may reveal that certain equities perform better with thresholds of 30 or higher.
The Deep Optimization Engine adds even more precision by testing variables like consolidation box sizes, ADX levels, and stop-loss distances. It processes years of historical data to surface the most robust breakout configurations.
For ongoing performance updates, the Weekly Scanners and Backtests — available with applicable plans — deliver periodic reports. These updates track how ADX breakout strategies are performing under current market conditions and suggest adjustments to keep trades aligned with evolving trends.
Setting Up Real-Time Alerts and Automation
LuxAlgo’s real-time alert systems remove the need for constant chart monitoring by notifying traders the moment defined ADX breakout criteria are met. These alerts can watch multiple timeframes and assets simultaneously, helping ensure opportunities aren’t missed.
The Custom Alert Creator enables highly specific, multi-condition alerts. For example: trigger only when ADX rises above 25, price breaks out of a consolidation zone, and volume exceeds the 20-day average by at least 50%.
With mobile integration, traders can receive alerts via email, SMS, or push notifications. This is especially useful for those who can’t monitor charts throughout the day but still want to act quickly on high-quality setups.
Finally, LuxAlgo’s support resources and education help traders optimize configurations and troubleshoot issues so automated systems run smoothly during critical trading periods. Explore plan options on the pricing page.
Risk Management and Best Practices for ADX Breakout Trading
Managing risk effectively in ADX breakout trading means fine-tuning your ADX settings to match both market conditions and your personal trading approach. A key aspect of this is adjusting the ADX period to align with the volatility of the market you're trading.
Adjusting ADX Settings for Different Markets
The default 14-period ADX setting works well for identifying trends, but it might need tweaking depending on how quickly a market moves. For intraday environments, shorter ADX periods — such as 7 or 9 — can deliver quicker momentum signals. By customizing ADX to suit the asset’s volatility and your trading timeframe, you can enhance the reliability of signals and better manage risk. For additional background, review this in-depth ADX guide.
To refine your strategy, make it a habit to backtest different ADX configurations using tools like the AI Backtesting Assistant. This will help you pinpoint the settings that lead to more consistent and dependable results.
Conclusion
The Rob Booker ADX Breakout approach blends trend-strength analysis with breakout confirmation to help traders identify promising entry points. In this guide, we’ve seen how the Average Directional Index (ADX) goes beyond being just a trend indicator — it becomes a powerful tool for spotting opportunities when prices break out of consolidation phases.
Success with ADX breakout trading lies in understanding its key signals. ADX values above 25 suggest strong momentum, while values below 20 indicate periods of consolidation. By waiting for these quieter phases and confirming breakouts with rising ADX levels, traders can improve their timing and minimize false signals.
LuxAlgo takes this strategy further by providing advanced confirmations, AI-driven backtesting, and real-time alerts. Its AI Backtesting documentation shows how to fine-tune ADX settings across timeframes and market conditions.
To adapt to different levels of market volatility, traders can tweak ADX settings — shorter periods like 7 or 9 are better suited for fast-paced intraday trading. Coupled with smart position sizing and carefully placed stop-losses, these adjustments help manage risk and enhance reliability in breakout strategies.
FAQs
What makes the Rob Booker ADX Breakout Indicator different from traditional breakout strategies?
The Rob Booker ADX Breakout Indicator takes a different approach from standard breakout strategies by incorporating the Average Directional Index (ADX) to gauge the strength of a trend. Rather than relying solely on price action or predefined support and resistance levels, this method emphasizes evaluating trend strength to validate breakouts.
By utilizing the ADX, the indicator seeks to refine entry timing and reduce the likelihood of false signals. This makes it a more targeted and dependable method for spotting potential breakout opportunities compared to traditional techniques.
How does LuxAlgo enhance the ADX Breakout Indicator for better trading signals?
LuxAlgo improves the ADX Breakout workflow by incorporating trend-strength filters that focus on identifying strong trends (for example, when ADX values exceed 25). This helps reduce false signals and ensures better timing for market entries.
On top of that, LuxAlgo provides real-time pattern detection and breakout alerts. These features integrate smoothly with ADX data, helping traders fine-tune their entry points. With these capabilities, traders can approach the market with greater accuracy and confidence.
How can traders customize ADX settings to match different market conditions and assets?
Traders can adjust ADX settings by modifying the indicator’s period length to better match market conditions or the characteristics of a specific asset. For markets with strong, steady trends, using a longer period — like 20 or 30 — can smooth out short-term noise and emphasize longer-term movements. On the other hand, a shorter period, such as 7 or 10, increases the ADX’s sensitivity, making it more effective for spotting rapid changes in volatile or range-bound markets.
Another way to refine the ADX is by tweaking threshold levels to account for market volatility or historical ADX trends. This adjustment helps traders assess trend strength more accurately across various asset classes, improving their ability to time entries. Testing these customizations in a demo environment can help you discover what aligns best with your trading style and the markets you focus on.
References
- LuxAlgo — Official Site
- AI Backtesting Assistant
- AI Backtesting Assistant Docs
- Signals & Overlays — Alerts
- Signals & Overlays — Overview
- Price Action Concepts — Overview
- Oscillator Matrix — Overview
- S&O Backtester — Overview
- PAC Backtester — Overview
- OSC Backtester — Overview
- Screeners — Overview
- S&O Backtester — TP/SL
- AI Backtesting: New Features
- Best Timeframe for Trading
- Managing Trade Risk
- External Resources
- Average Directional Index (Wikipedia)
- Average Directional Index (Investopedia)


