
Compare two popular technical analysis platforms, exploring their features, strengths, and ideal user profiles for informed trading strategies.
Looking for the best solutions for technical analysis? Here's a quick comparison of two popular platforms: StockCharts.com and LuxAlgo.
- StockCharts.com: Ideal for in-depth charting and traditional technical analysis. Offers 66 indicators, historical data since 1900, and educational resources like ChartSchool.
- LuxAlgo: Provides hundreds of free trading indicators in the Library and exclusive toolkits on TradingView, including automated pattern detection and real-time signals. Learn more on the homepage.
Key Takeaways
- StockCharts.com is perfect for users wanting highly customizable charts and deep-dive analysis.
- LuxAlgo simplifies decision-making with its free Indicator Library and exclusive toolkits on TradingView (PAC, S&O, OSC).
Quick Comparison
| Feature | StockCharts.com | LuxAlgo |
|---|---|---|
| Charting | Highly customizable | Via TradingView with automated overlays (learn more) |
| Indicators | 66 traditional indicators | Free Library + exclusive PAC, S&O, OSC |
| Alerts | Custom price/technical alerts | Toolkit events & custom alerts (how alerts work) |
| Pricing | Starts at $18.42/month | Free plan ($0). Premium $39.99/mo. Ultimate $59.99/mo. (see pricing) |
| Education | ChartSchool tutorials | Video guides & community docs (get started) |
Both platforms cater to different needs: StockCharts.com is great for detailed manual analysis, while LuxAlgo is ideal for traders who want automated insights and optional AI backtesting (learn about AI Backtesting).
Webull vs. TradingView: The Ultimate Comparison

1. StockCharts.com Core Features
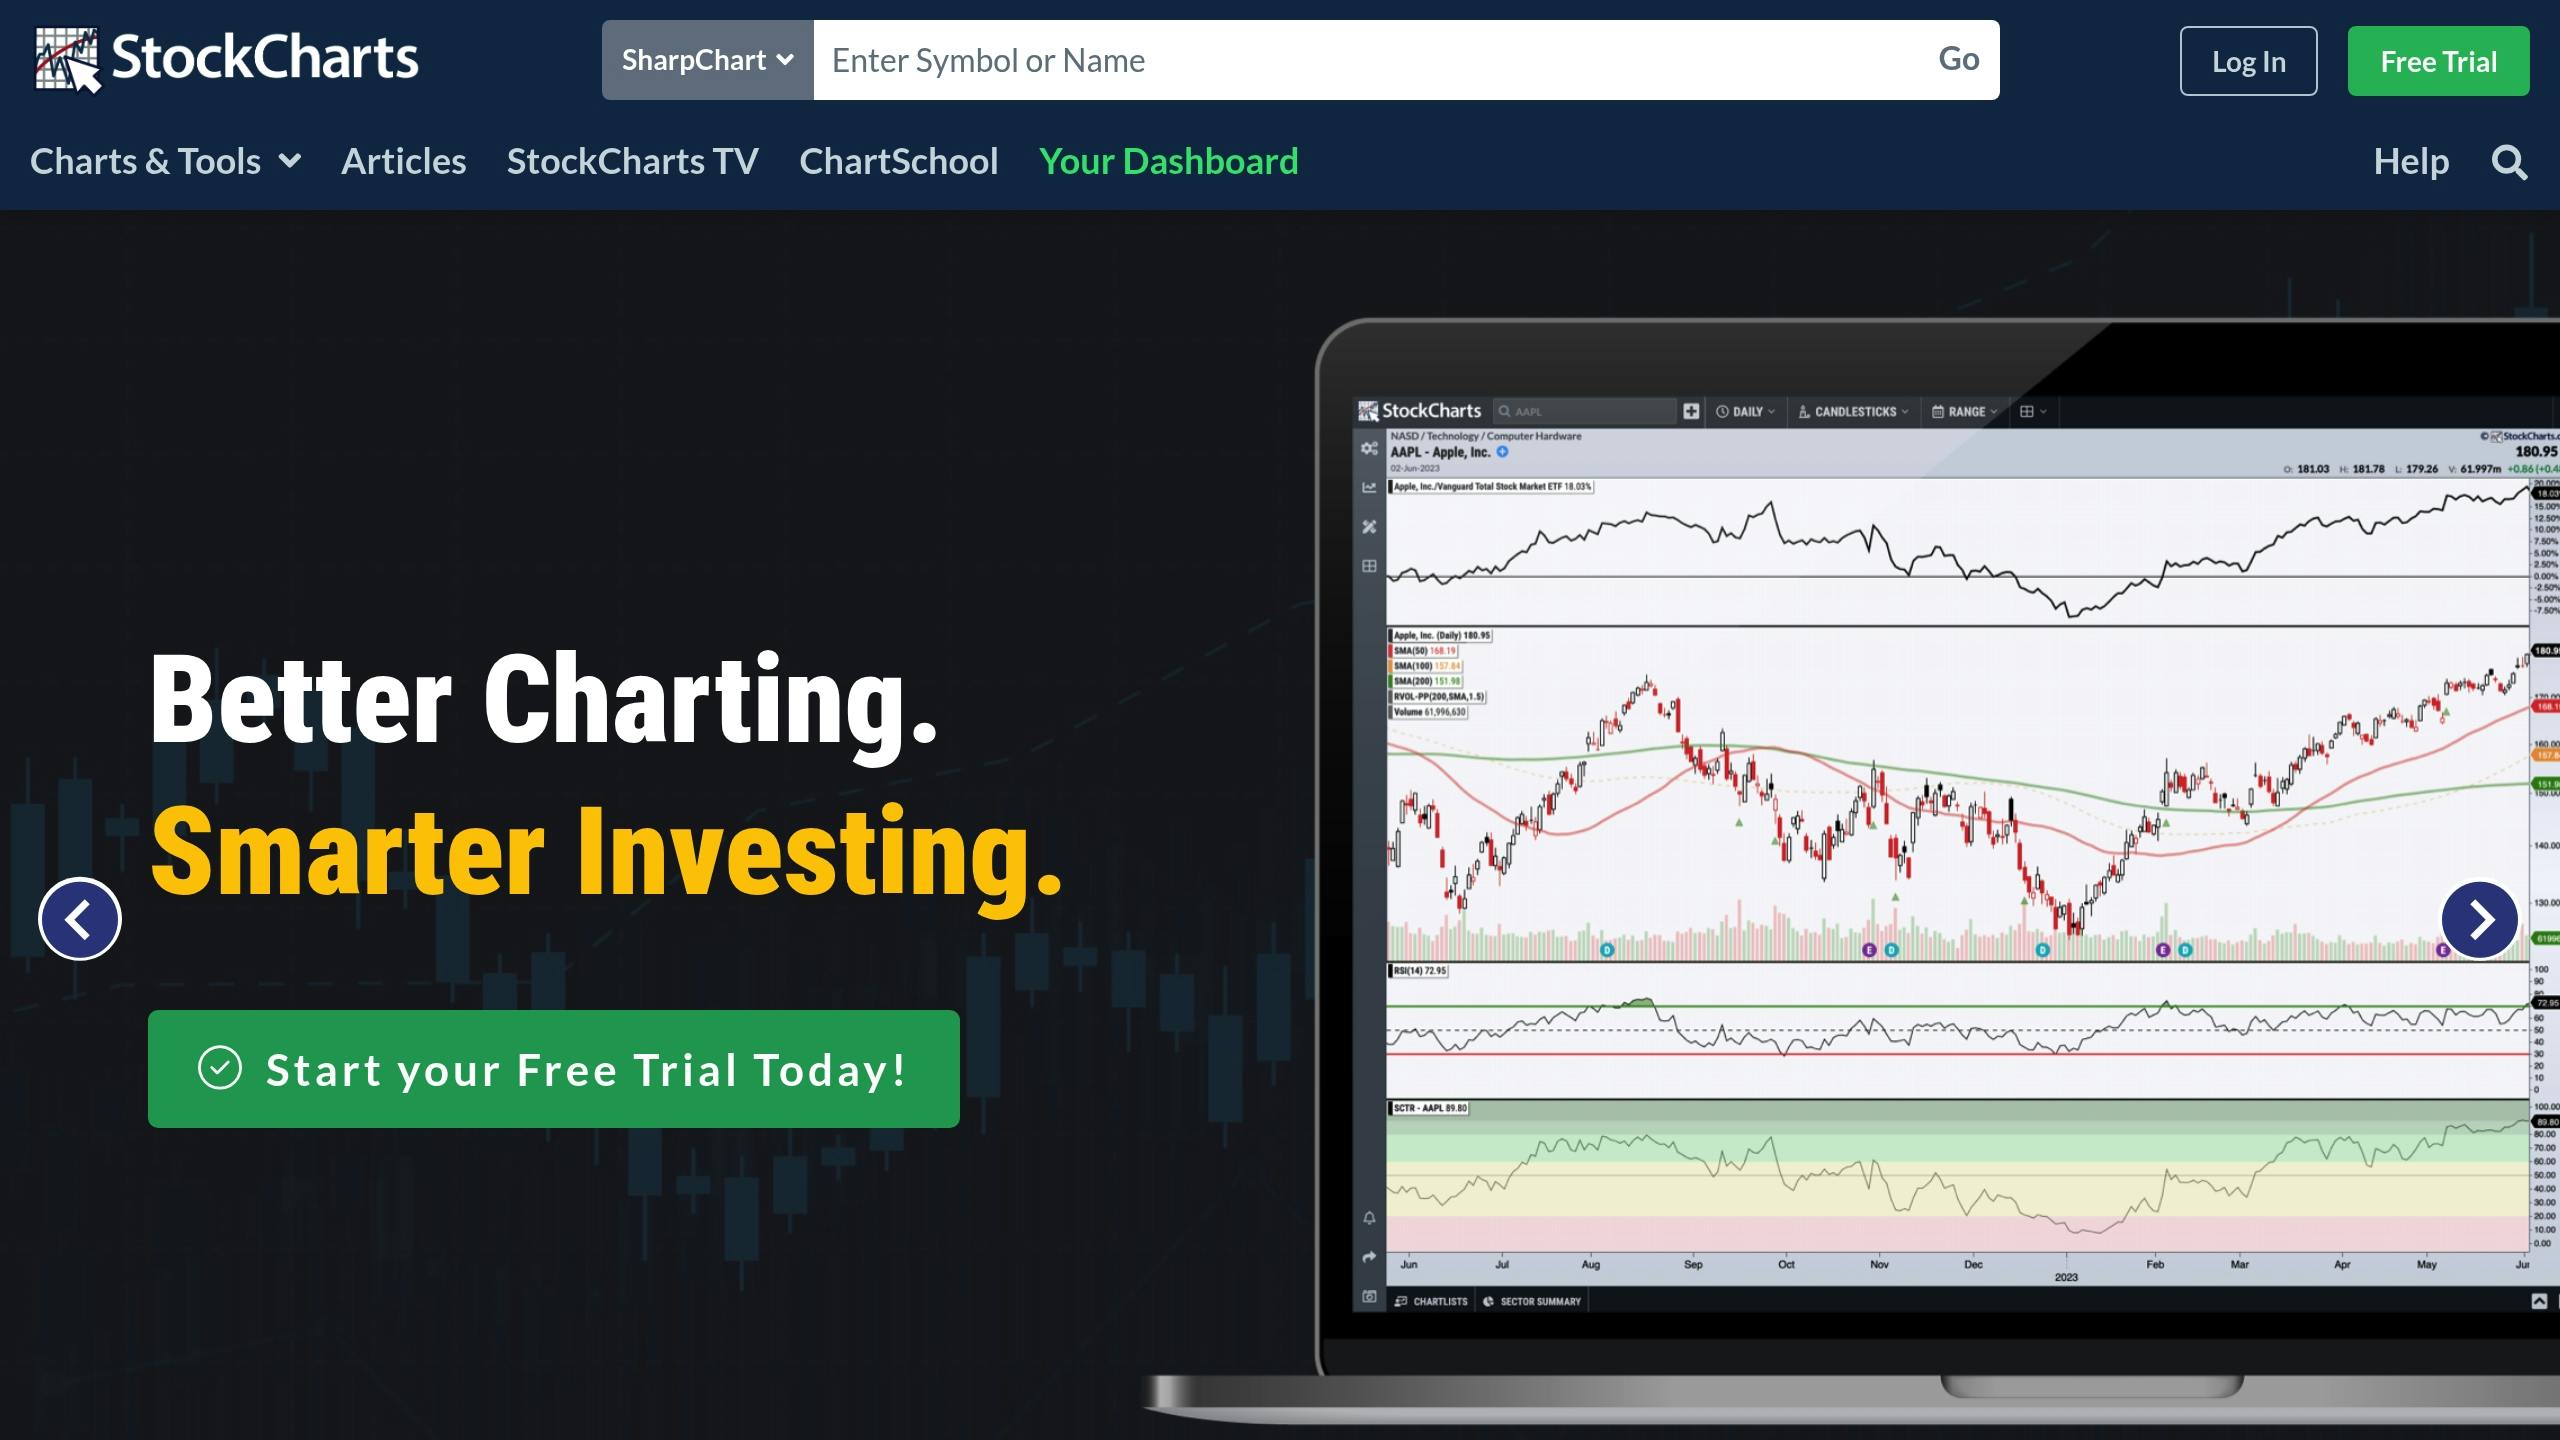
StockCharts.com offers powerful capabilities for visual analysis, centered around two main platforms: SharpCharts and StockChartsACP.
SharpCharts Platform
SharpCharts provides detailed charting with up to 25 indicators and multiple chart styles (Point & Figure, Seasonality, RRG) for comprehensive technical setups.
Advanced Charting Platform (ACP)
StockChartsACP is an interactive platform with direct chart trading, advanced scans, and customizable market tracking tools.
Market Scanning & Alerts
The “Scheduled Scans” feature automates market analysis at set times, and “Earnings Dates” chart markers flag key corporate events (what earnings announcements are).
ChartLists Organization
Custom ChartLists let users organize watchlists across devices, making it easy to monitor multiple strategies in one place.
Educational Resources
ChartSchool offers extensive technical analysis tutorials, while ChartPacks provide ready-made ChartLists for quick market entry.
2. LuxAlgo Trading Tools
LuxAlgo integrates directly with TradingView, offering a Library of free indicators and three exclusive toolkits to streamline analysis for traders of all levels.
Main Toolkits
- Price Action Concepts (PAC): Automates market structure and pattern detection (market structure overview).
- Signals & Overlays (S&O): Provides multiple signal algorithms with customizable overlays (signal modes).
- Oscillator Matrix (OSC): Detects divergences and trend signals based on market activity (HyperWave, Confluence).
Advanced Indicator Spotlight
The Fibonacci Ranges (Real-Time) indicator combines Fibonacci ratios and swing patterns to highlight potential reversals and breakouts, with adjustable settings for tailored analysis. You can also explore Targets for Many Indicators or Pure Price Action Structures.
Screeners & Backtesters
Each toolkit includes complimentary screeners and backtesters on TradingView:
| Feature | Capability | Application |
|---|---|---|
| AI Backtesting Assistant | Conversational AI for strategy creation | Discover & test strategies across markets (docs) |
| PAC Screener / S&O Screener / OSC Screener | Filters high-probability setups | Scan multiple markets in real time |
| Backtesters (PAC / S&O) | Custom entry/exit logic | Optimize with rules & risk controls |
| Custom Alerts | Signals toolkit events | Notifies on breakouts & reversals |
Community & Support
LuxAlgo provides detailed documentation, video tutorials, and a Discord community for rapid assistance (documentation hub).
“All content provided by LuxAlgo is for informational & educational purposes only. Past performance does not guarantee future results.” – LuxAlgo
Direct Platform Comparison
StockCharts.com and LuxAlgo cater to different trading approaches: one focused on traditional chart customization, the other on automated, toolkit-driven insights. LuxAlgo also offers optional AI backtesting for strategy discovery and validation (see how it works).
Feature Comparison
| Feature Category | StockCharts.com | LuxAlgo |
|---|---|---|
| Charting | Customizable on proprietary platforms | Via TradingView with automated overlays (details) |
| Indicators | Traditional library (66+) | Library + PAC, S&O, OSC |
| Scanning | Scheduled Scans | Tool-specific screeners (PAC, S&O, OSC) |
| Alerts | Custom technical alerts | Toolkit-based real-time signals (S&O settings) |
| Education | ChartSchool & tutorials | Video guides & docs (PAC settings) |
| Backtesting | Not built-in | AI Backtesting Assistant (introduction) |
Pricing Structure
| Plan Level | StockCharts.com (Monthly) | LuxAlgo (Monthly) |
|---|---|---|
| Entry | Basic: $18.42 | Free Plan: $0 |
| Mid-tier | Extra: $27.65 | Premium: $39.99 |
| Advanced | Pro: $46.11 | Ultimate: $59.99 |
References
LuxAlgo Resources
- LuxAlgo – Official Site
- Indicator Library
- Price Action Concepts (PAC)
- Signals & Overlays (S&O)
- Oscillator Matrix (OSC)
- Fibonacci Ranges (Real‑Time)
- Targets for Many Indicators
- Pure Price Action Structures
- AI Backtesting Assistant
- AI Backtesting Docs
- Backtesters Overview
- Backtester (PAC) – Intro
- Backtester (S&O) – Intro
- PAC Screener – Intro
- S&O Screener – Intro
- OSC Screener – Intro
- Signals & Overlays – Signal Modes
- Signals & Overlays – Indicator Overlays
- PAC – Market Structure
- PAC – Settings
- S&O – Settings
- Pricing


