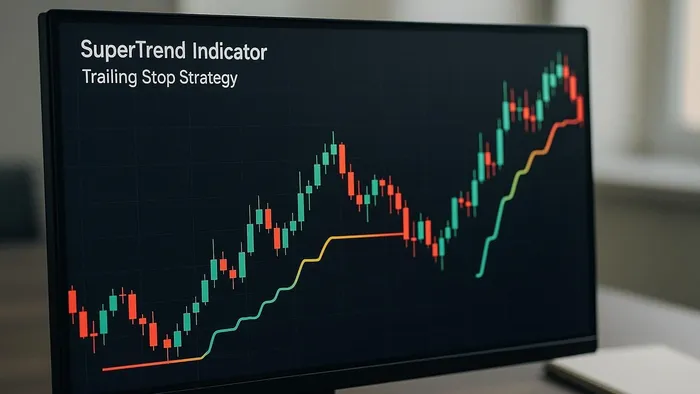

Explore the SuperTrend Indicator for effective trend identification and dynamic risk management in trading across various markets.
The SuperTrend Indicator is a simple yet powerful resource for identifying market trends and managing trades with trailing stops from the LuxAlgo Library. Here's what you need to know upfront:
- How It Works: Combines market volatility (ATR) and a multiplier to create dynamic support & resistance levels.
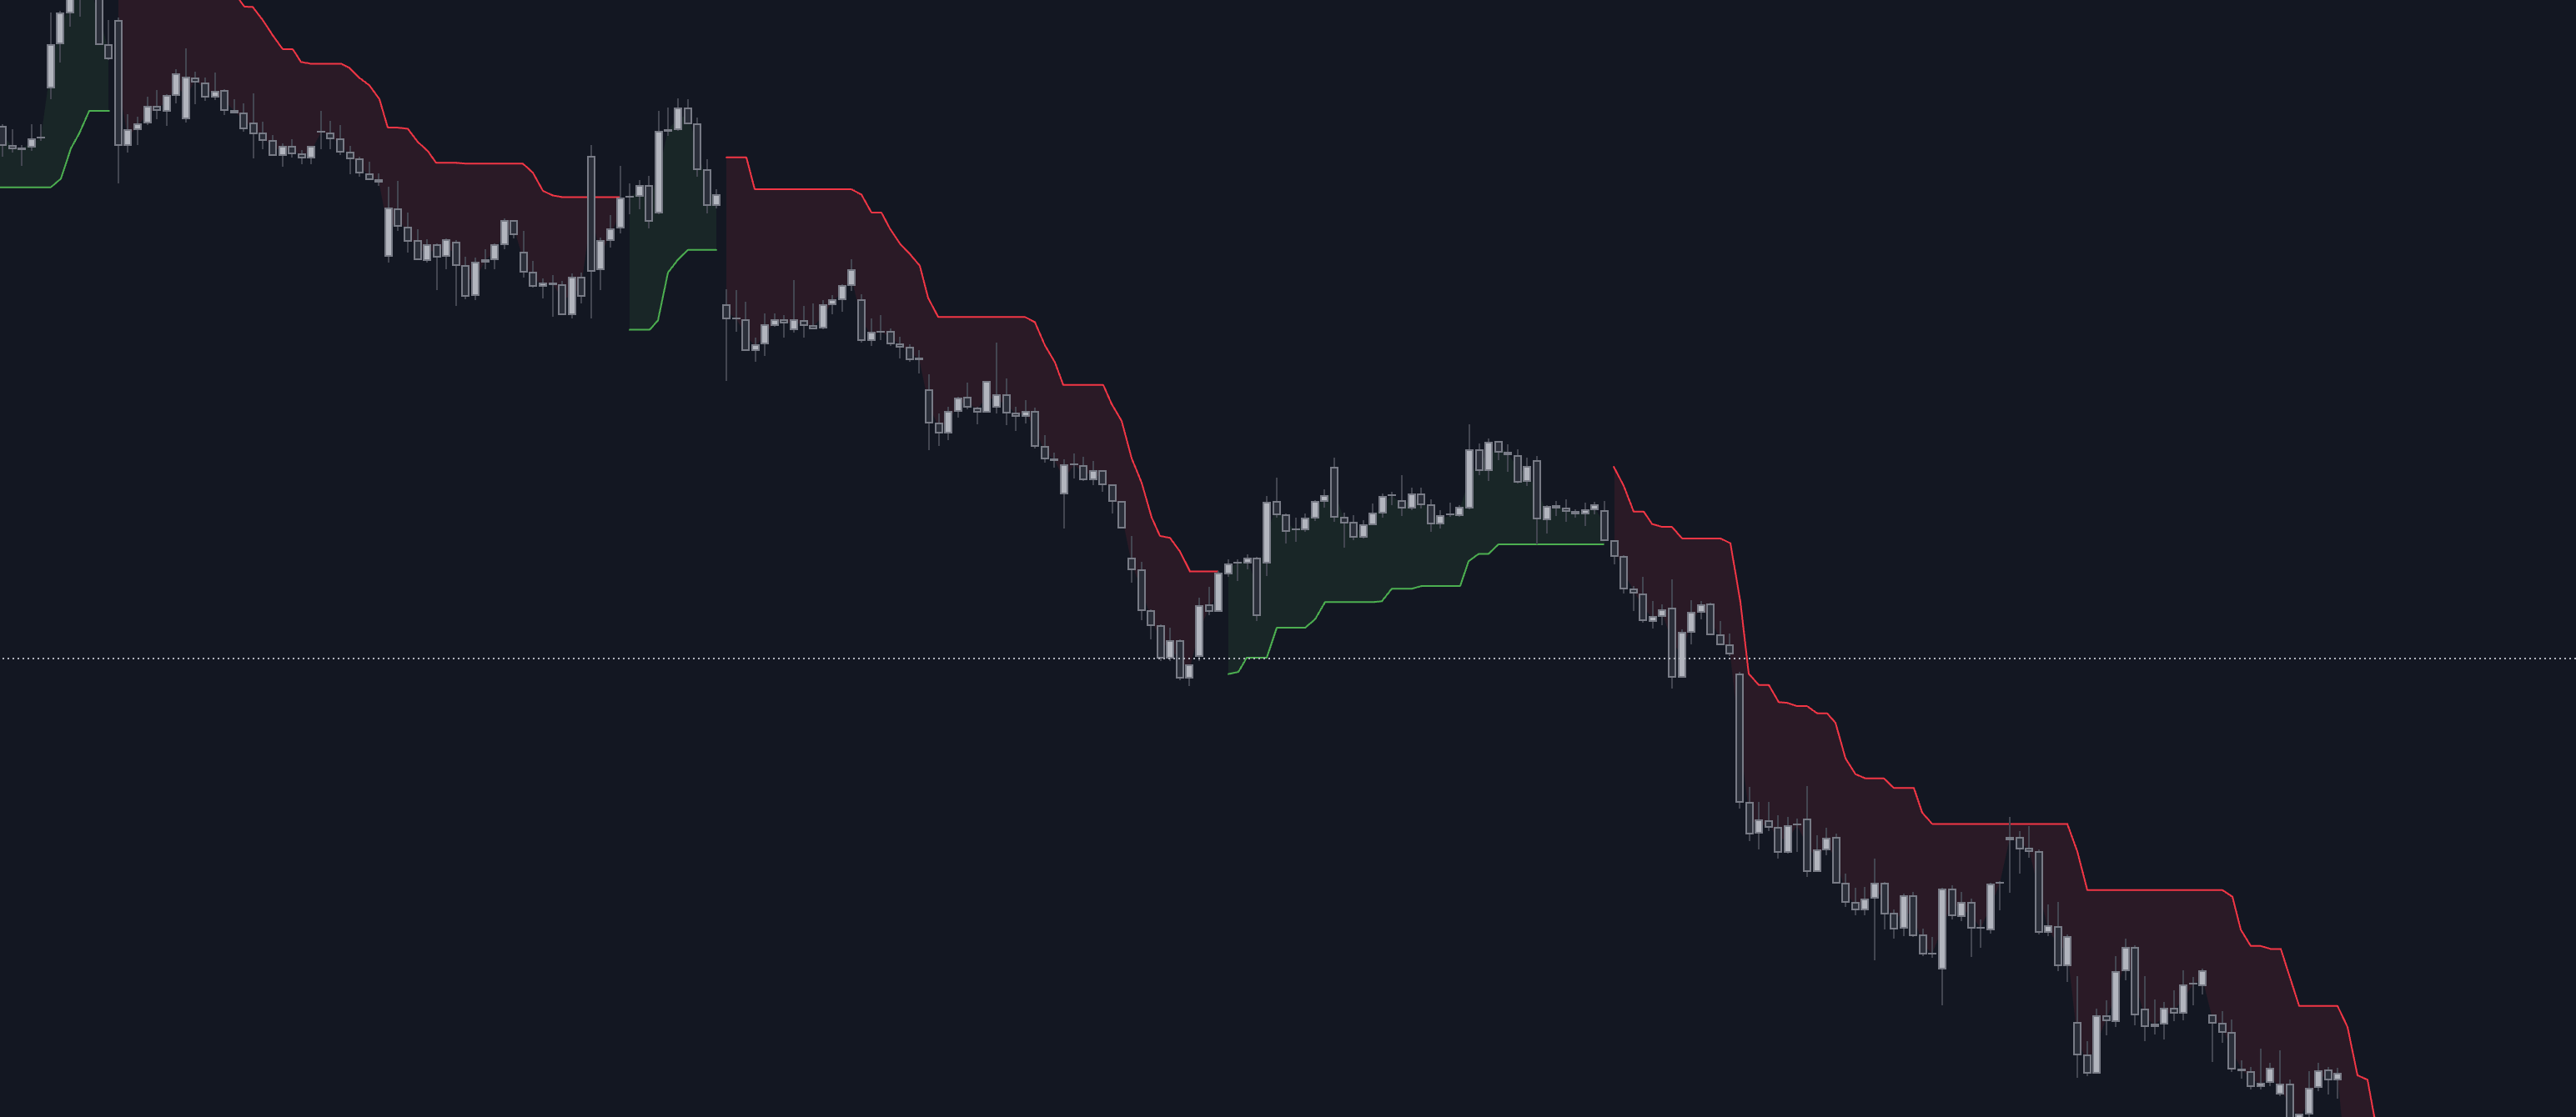
- Trend Signals: A green line below the price indicates an up-trend, while a red line above the price signals a down-trend.
- Trailing Stops: Automatically adjusts stop levels based on market volatility, widening during high volatility and tightening in calm markets.
- Performance Stats: Back-testing shows an average profit of 11.07 % per trade with a 67 % accuracy rate.
Quick Overview of Key Settings
- ATR Period: Shorter periods (7–10) for day trading; longer (10–14+) for swing & position trading.
- Multiplier: Lower values (2.0–2.5) for tighter stops; higher values (3.0–3.5) for wider stops in volatile markets.
- Market-Specific Settings:
- Stocks: Conservative (ATR 14, Multiplier 4.0) or Aggressive (ATR 7, Multiplier 2.0).
- Forex: ATR 10, Multiplier 3.0 for balance.
- Crypto: ATR 14, Multiplier 3.5 for high volatility.
Why Use It?
- Dynamic Risk Management: Adjusts stops automatically to market conditions.
- Clear Signals: Easy-to-read buy/sell indicators.
- Versatility: Works across stocks, forex, crypto, and multiple time-frames.
To get started, pair it with momentum indicators like RSI for confirmation, test different settings, and align your strategy with your trading style. It’s a straightforward way to manage risk and maximise profits in trending markets.
The SuperTrend Indicator: Tutorial
How the SuperTrend Indicator Works
The SuperTrend indicator—part of the Signals & Overlays Toolkit—blends price movements with market volatility to create straightforward trading signals. Understanding its mechanics can help you fine-tune trailing stops and improve your trading strategy.
Basic Formula and Components
At its core, the SuperTrend indicator relies on two key calculations to determine trend direction and stop levels:
- Upper Band = (High + Low) / 2 + (Multiplier × ATR)
- Lower Band = (High + Low) / 2 − (Multiplier × ATR)
Here, ATR (Average True Range) is calculated as:
ATR = (Previous ATR × (n − 1) + TR) / nwhere n is the chosen period and TR refers to the true range. This setup creates dynamic support & resistance levels. The bands expand in volatile markets and contract when conditions are calm.
Reading Trend Signals
- Green line below price: Up-trend. Place the trailing stop beneath this line.
- Red line above price: Down-trend. Position the stop above this line.
- Line crossovers: Potential trend reversals.
ATR and Market Volatility
| Market Condition | ATR Impact | Stop Distance |
|---|---|---|
| High Volatility | Increases | Wider stops |
| Low Volatility | Decreases | Tighter stops |
| Stable Trend | Consistent | Consistent spacing |
Guidelines:
- Short-term trading: ATR 7–10
- Swing trading: ATR 10–13
- Position trading: ATR 14+
Setting Up SuperTrend Parameters
ATR Period Selection
The ATR period sets the indicator’s sensitivity. Day traders favour 7–10; swing traders 10–13; position traders 14+. Shorter periods respond quickly but can whipsaw; longer periods filter noise.
| Trading Style | ATR Period | Sensitivity | Ideal For |
|---|---|---|---|
| Day Trading | 7–10 | High | Fast market moves |
| Swing Trading | 10–13 | Medium | Balanced signals |
| Position Trading | 14+ | Low | Fewer false signals |
Multiplier Settings
- 2.0–2.5: Tight stops for quick profits.
- 2.6–3.0: Balanced approach.
- 3.1–3.5: Wide stops for volatile markets.
Settings by Market Type
| Market | Style | ATR | Multiplier | Notes |
|---|---|---|---|---|
| Stocks | Conservative | 14 | 4.0 | Wider stops |
| Stocks | Aggressive | 7 | 2.0 | Quick entries/exits |
| Forex | Standard | 10 | 3.0 | Major pairs |
| Crypto | Volatile | 14 | 3.5 | High volatility |
Trading with SuperTrend Stops
Entry Point Selection
- Long: Price closes above line, line turns green, price respects support.
- Short: Price closes below line, line turns red, price respects resistance.
Stop Loss Management
- Long: Stop just below the SuperTrend line.
- Short: Stop just above the line.
- Trail stops as the line moves.
Trade Exit Rules
- Two-Wave Trailing: After first pullback.
- Time-frame Targets: (10,3) on 1-min aiming for 0.3–0.5 %.
- Volatility-Based: Let stops widen in fast markets.
Additional Technical Indicators
Enhance your SuperTrend strategy with confirming tools.
Momentum Indicators
- Long: SuperTrend green and RSI > 60.
- Short: SuperTrend red and RSI < 40.
Volume Analysis
Look for volume spikes on reversals; combine with VWMA to filter noise.
Multiple Time-Frame Analysis
| Time-frame | Use | Signal Strength |
|---|---|---|
| Monthly/Weekly | Trend filter | Strong |
| Daily | Setup | Medium |
| Hourly/15-min | Timing | Immediate |
Align trends across charts before entry. The Multi-Time-Frame SuperTrend Dashboard helps automate this workflow.
Testing and Risk Management
Strategy Testing Methods
- Define ATR & multiplier parameters.
- Select a representative time-frame.
- Log every trade.
- Assess results in trending and sideways conditions.
Automate with LuxAlgo’s AI Backtesting Assistant. A Nov 2016–Nov 2023 study combining SuperTrend + MACD delivered an 11.61 % annualised ROI, beating buy-and-hold by 198.16 %.
Position Size Calculation
| Risk Component | Recommended | Adjustment |
|---|---|---|
| Account Risk per Trade | ≤ 1 % | Account size |
| Stop Loss Distance | ATR-based | Volatility |
| Position Size | Dynamic | Volatility |
Position Size = (Account Balance × Risk %) ÷ (Stop Loss × Point Value)Scale out: first target 1:1, second 2:1, remainder trails with SuperTrend.
Common Pitfalls
- Signal Lag leading to late entries/exits.
- Parameter Over-fitting to past data.
- Ignoring Fundamentals in catalyst-driven moves.
- Wrong ATR Settings causing false signals.
A Taiwan electronics basket (Jan 2019–Jul 2024) achieved a 25.88 % annualised return with disciplined parameter tuning and risk control.
Summary
The SuperTrend indicator unites trend-following and risk-management principles, forming a robust trailing-stop resource. Its key strengths:
- Volatility-adjusted stops that adapt to market change
- Clear colour-coded signals for quick decisions
- Automated profit protection via trailing stops
Best practice: combine with momentum confirmation, tailor parameters to volatility, and validate entries across time-frames.
FAQs
How do I adjust SuperTrend settings for different market conditions and trading styles?
Adjust the ATR period and multiplier. A default ATR 10 / Mult 3.0 works widely, but volatile markets may need ATR 7 or a higher multiplier. Experiment across charts—longer time-frames give steadier swing signals, shorter charts suit day trading. See this guide on fetching strategies for more detail.
What challenges can arise when using the SuperTrend indicator, and how can I address them?
Sideways markets can create false signals. Combine SuperTrend with confirming indicators (e.g., moving averages) and place stop-loss orders just beyond the SuperTrend line to manage risk.
How does the SuperTrend indicator perform compared to other trend-following tools?
SuperTrend gives clear visual cues, but like most trend followers, it lags in choppy conditions. Pairing it with complementary tools can boost effectiveness.
References
- Fibonacci Trailing Stop – LuxAlgo
- Dynamic Support & Resistance – LuxAlgo
- Oscillator Matrix Reversal Signals – Documentation
- SuperTrend AI Clustering – LuxAlgo
- Candle-Body Support & Resistance – LuxAlgo
- Volume Delta Trailing Stop – LuxAlgo
- SuperTrend Channels – LuxAlgo
- Best Indicator Settings & Time-frames – LuxAlgo Blog
- S&O Backtester TP/SL – Documentation
- Managing Trade Risk – LuxAlgo Blog
- Trailing Stop Tool – Documentation
- SuperTrend AI Clustering Script – TradingView
- LuxAlgo Library – Homepage
- Signals & Overlays Toolkit – Documentation
- AI Backtesting Assistant – LuxAlgo


