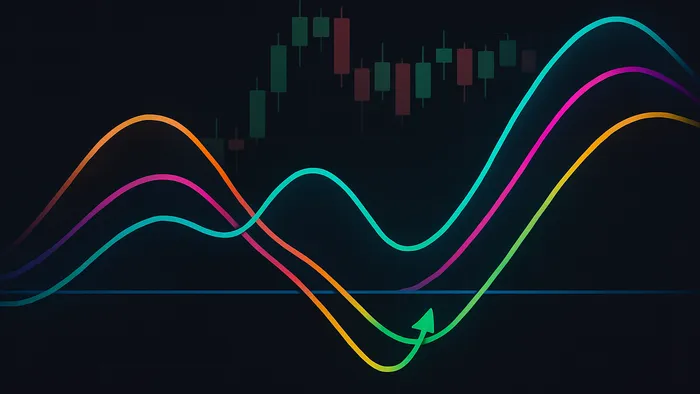

Explore the TRIX indicator, a powerful tool for identifying trends and momentum changes while filtering out market noise in trading.
The TRIX indicator is a momentum tool that helps traders identify trends by cutting through market noise. It uses triple exponential smoothing to provide clearer signals and reduce false breakouts. TRIX oscillates around a zero line, with positive values signaling upward momentum and negative values indicating downward momentum.
Key Points:
- Purpose: Highlights trend direction and momentum changes while filtering out short-term volatility.
- How It Works: Calculates the percentage change in a triple-smoothed EMA (see a primer on the exponential moving average).
- Signals: Zero-line crossovers and divergences indicate potential trend shifts.
- Settings: Default periods vary (e.g., 14, 15, or 18), and traders can adjust for sensitivity.
Benefits:
- Reduces market noise.
- Detects overbought/oversold conditions.
- Works well in trending markets.
Limitations:
- May lag during rapid reversals.
- Can produce false signals in sideways markets.
Pairing TRIX with other indicators like RSI, moving averages, or volume tools improves accuracy. Adjust settings based on your trading style and use risk management strategies for better results.
How to Trade With TRIX Indicator (Triple Exponential Average: Forex & Stock Strategy)
TRIX Calculation Method
Understanding how TRIX is calculated sheds light on why it’s so effective at filtering out market noise. The process involves several layers of exponential smoothing, which help create a cleaner and more reliable signal compared to standard moving averages.
Step-by-Step Calculation Process
The TRIX calculation unfolds in four distinct steps, each designed to reduce volatility and emphasize genuine trends:
- Step 1: Start by calculating the first exponential moving average (EMA) of the closing prices over your chosen period, typically between 14 and 18 periods.
- Step 2: Apply a second EMA to the result from Step 1, creating a double-smoothed average.
- Step 3: Perform a third EMA calculation using the output from Step 2. This extra smoothing step further filters out market noise.
- Step 4: Finally, calculate the percentage change between the current day’s triple-smoothed EMA and the previous day’s triple-smoothed EMA. This percentage difference becomes the TRIX value.
Here’s the formula for TRIX:
TRIX = [(Current Triple EMA - Previous Triple EMA) / Previous Triple EMA] × 100
TRIX oscillates around zero, with positive values signaling upward momentum and negative values indicating downward pressure. The triple smoothing method reduces lag compared to traditional EMAs, while staying responsive to meaningful price changes.
"The idea behind TEMA is to use multiple EMA calculations and subtract out some of the lag that occurs in a single EMA. The result is a moving average that stays closer to the price bars than a traditional EMA and reacts faster to trend changes." - FasterCapital [8]
This multi-step calculation is what gives TRIX its ability to highlight momentum shifts. By understanding this process, traders can fine-tune the indicator for various market conditions.
Default Settings and Parameter Changes
The way TRIX is calculated explains why changing its settings can lead to different signal behaviors. Different trading platforms often use varying default settings for TRIX. For instance:
- StockCharts.com applies a 15-period TRIX with a 9-period signal line.
- TradingView commonly uses an 18-period TRIX by default.
- Zerodha Kite opts for a 14-period setting [4][5][6].
Despite these differences, the core calculation remains consistent.
Shorter periods (e.g., 5–12) create more sensitive signals, making them ideal for day trading and capturing quick crossovers near the centerline [4][5]. On the other hand, longer periods (e.g., 18–45) produce smoother signals, which are better suited for swing or position trading, where fewer but more reliable signals are preferred [4][6].
For example, shorter TRIX periods can be effective for intraday trading, as seen in stocks like Infosys Technologies [6]. Conversely, longer periods are often used on weekly charts by traders aiming to hold positions over extended periods, such as in ICICI Bank stock analysis [6].
The signal line period, often set to 9 by default, can also be adjusted. A shorter signal line period results in more frequent crossovers, which may suit active traders. A longer signal line period, however, reduces the number of signals, potentially increasing accuracy.
"Most trading platforms use a default 14-period when calculating TRIX, but the parameters can be adjusted according to the needs of the trader." - AvaTrade [1]
Adjust your TRIX settings based on your trading goals. Whether you’re looking for rapid signals for intraday trades or smoother trends for longer-term positions, experimenting with different parameter combinations can help you optimize the indicator. Keep in mind, though, that no single configuration works flawlessly in every market condition. Regularly reviewing and tweaking your settings is key to achieving consistent results.
Reading TRIX Signals
Understanding TRIX signals, particularly the zero-line crossover, is essential for identifying shifts in momentum and potential trend reversals.
Zero-Line Crossovers
A TRIX line crossing above the zero line suggests that bullish momentum is gaining strength, pointing to the start of an uptrend[7][1][9][2][5][10]. On the other hand, when the TRIX line dips below the zero line, it indicates growing bearish momentum, hinting at the possibility of a downtrend[7][4][9][2][5][10]. In the next section, we’ll dive into additional TRIX signals like divergences and how they confirm trend strength.
TRIX Trading Strategies
Dive into TRIX trading strategies to refine your entry, exit, and risk management techniques, using its signals to navigate the market effectively.
Entry and Exit Points with TRIX
To make the most of TRIX signals, focus on precise entry and exit timing.
Entry strategies aim to catch momentum shifts as they begin. A bullish signal occurs when TRIX crosses above the zero line, indicating upward momentum. This is often an ideal point to enter a long position, especially after a consolidation phase or a reversal. On the other hand, when TRIX drops below zero, it signals bearish momentum. This is typically a good time to consider a short position, particularly after overbought conditions or a failed rally.
For exit strategies, timing is everything. For long trades, consider exiting when TRIX peaks or starts to decline before dipping back to zero. This allows you to lock in gains while avoiding a full trend reversal. For short trades, cover your position when TRIX begins curving upward from its lowest point, signaling a potential end to the downward movement.
Divergence signals can also provide valuable entry opportunities. If the price hits a new high but TRIX does not, this bearish divergence suggests weakening momentum, making it a potential short entry point. Conversely, if the price makes a new low but TRIX forms a higher low, this bullish divergence points to growing upward momentum, signaling a long entry.
TRIX with Other Technical Indicators
TRIX becomes even more effective when paired with complementary indicators, helping to confirm signals and reduce false readings.
- RSI (Relative Strength Index): Combining TRIX with RSI can strengthen your momentum analysis. For instance, a TRIX crossover above zero paired with RSI moving above 50 provides a double confirmation of bullish momentum. Learn more about RSI.
- Moving Averages: Use a 50-period moving average to filter trades. Only take long positions when the price is above this moving average and short positions when it’s below. This ensures your trades align with the broader trend. See market overview pages to practice spotting trend context.
- Volume Indicators: Tools like On-Balance Volume (OBV) can validate TRIX signals. A bullish TRIX crossover accompanied by rising OBV suggests genuine buying interest, while bearish TRIX signals with falling OBV indicate real selling pressure.
- Support and Resistance Levels: TRIX signals near key price levels can be particularly powerful. For example, a breakout above resistance combined with a bullish TRIX crossover, or a breakdown below support paired with a bearish TRIX signal, offers higher-probability trade setups. If you’re new to the concept, review exchange-grade technical analysis basics.
By combining TRIX with these tools, you can enhance your trading precision and confidence.
Risk Management Guidelines
Effective risk management is essential to consistently succeed with TRIX-based strategies.
- Timeframes: Use daily or weekly charts for primary TRIX signals, and rely on shorter timeframes only for fine-tuning entry points.
- Position Sizing: Adjust your position size based on the strength of the signal. If multiple indicators confirm a TRIX signal at a key technical level, a larger position may be warranted. For weaker or standalone signals, consider reducing your position size.
- Stop-Loss Placement: Place stop-loss orders beyond recent swing points rather than using arbitrary percentages. For example, if you enter a long trade on a bullish TRIX crossover, set your stop below the last swing low before the signal. This allows the trade some breathing room while protecting against a genuine trend reversal.
- Avoid Whipsaws: In choppy markets, wait for TRIX signals to persist for two or three periods before acting. Look for confirmation from price action or other indicators to avoid getting caught in false moves.
- Market Conditions: TRIX works best in trending markets and tends to struggle during extended sideways movements. In low-volatility environments or when major indices show conflicting signals, it’s wise to reduce position sizes or step back entirely until clearer trends emerge.
Using TRIX with LuxAlgo
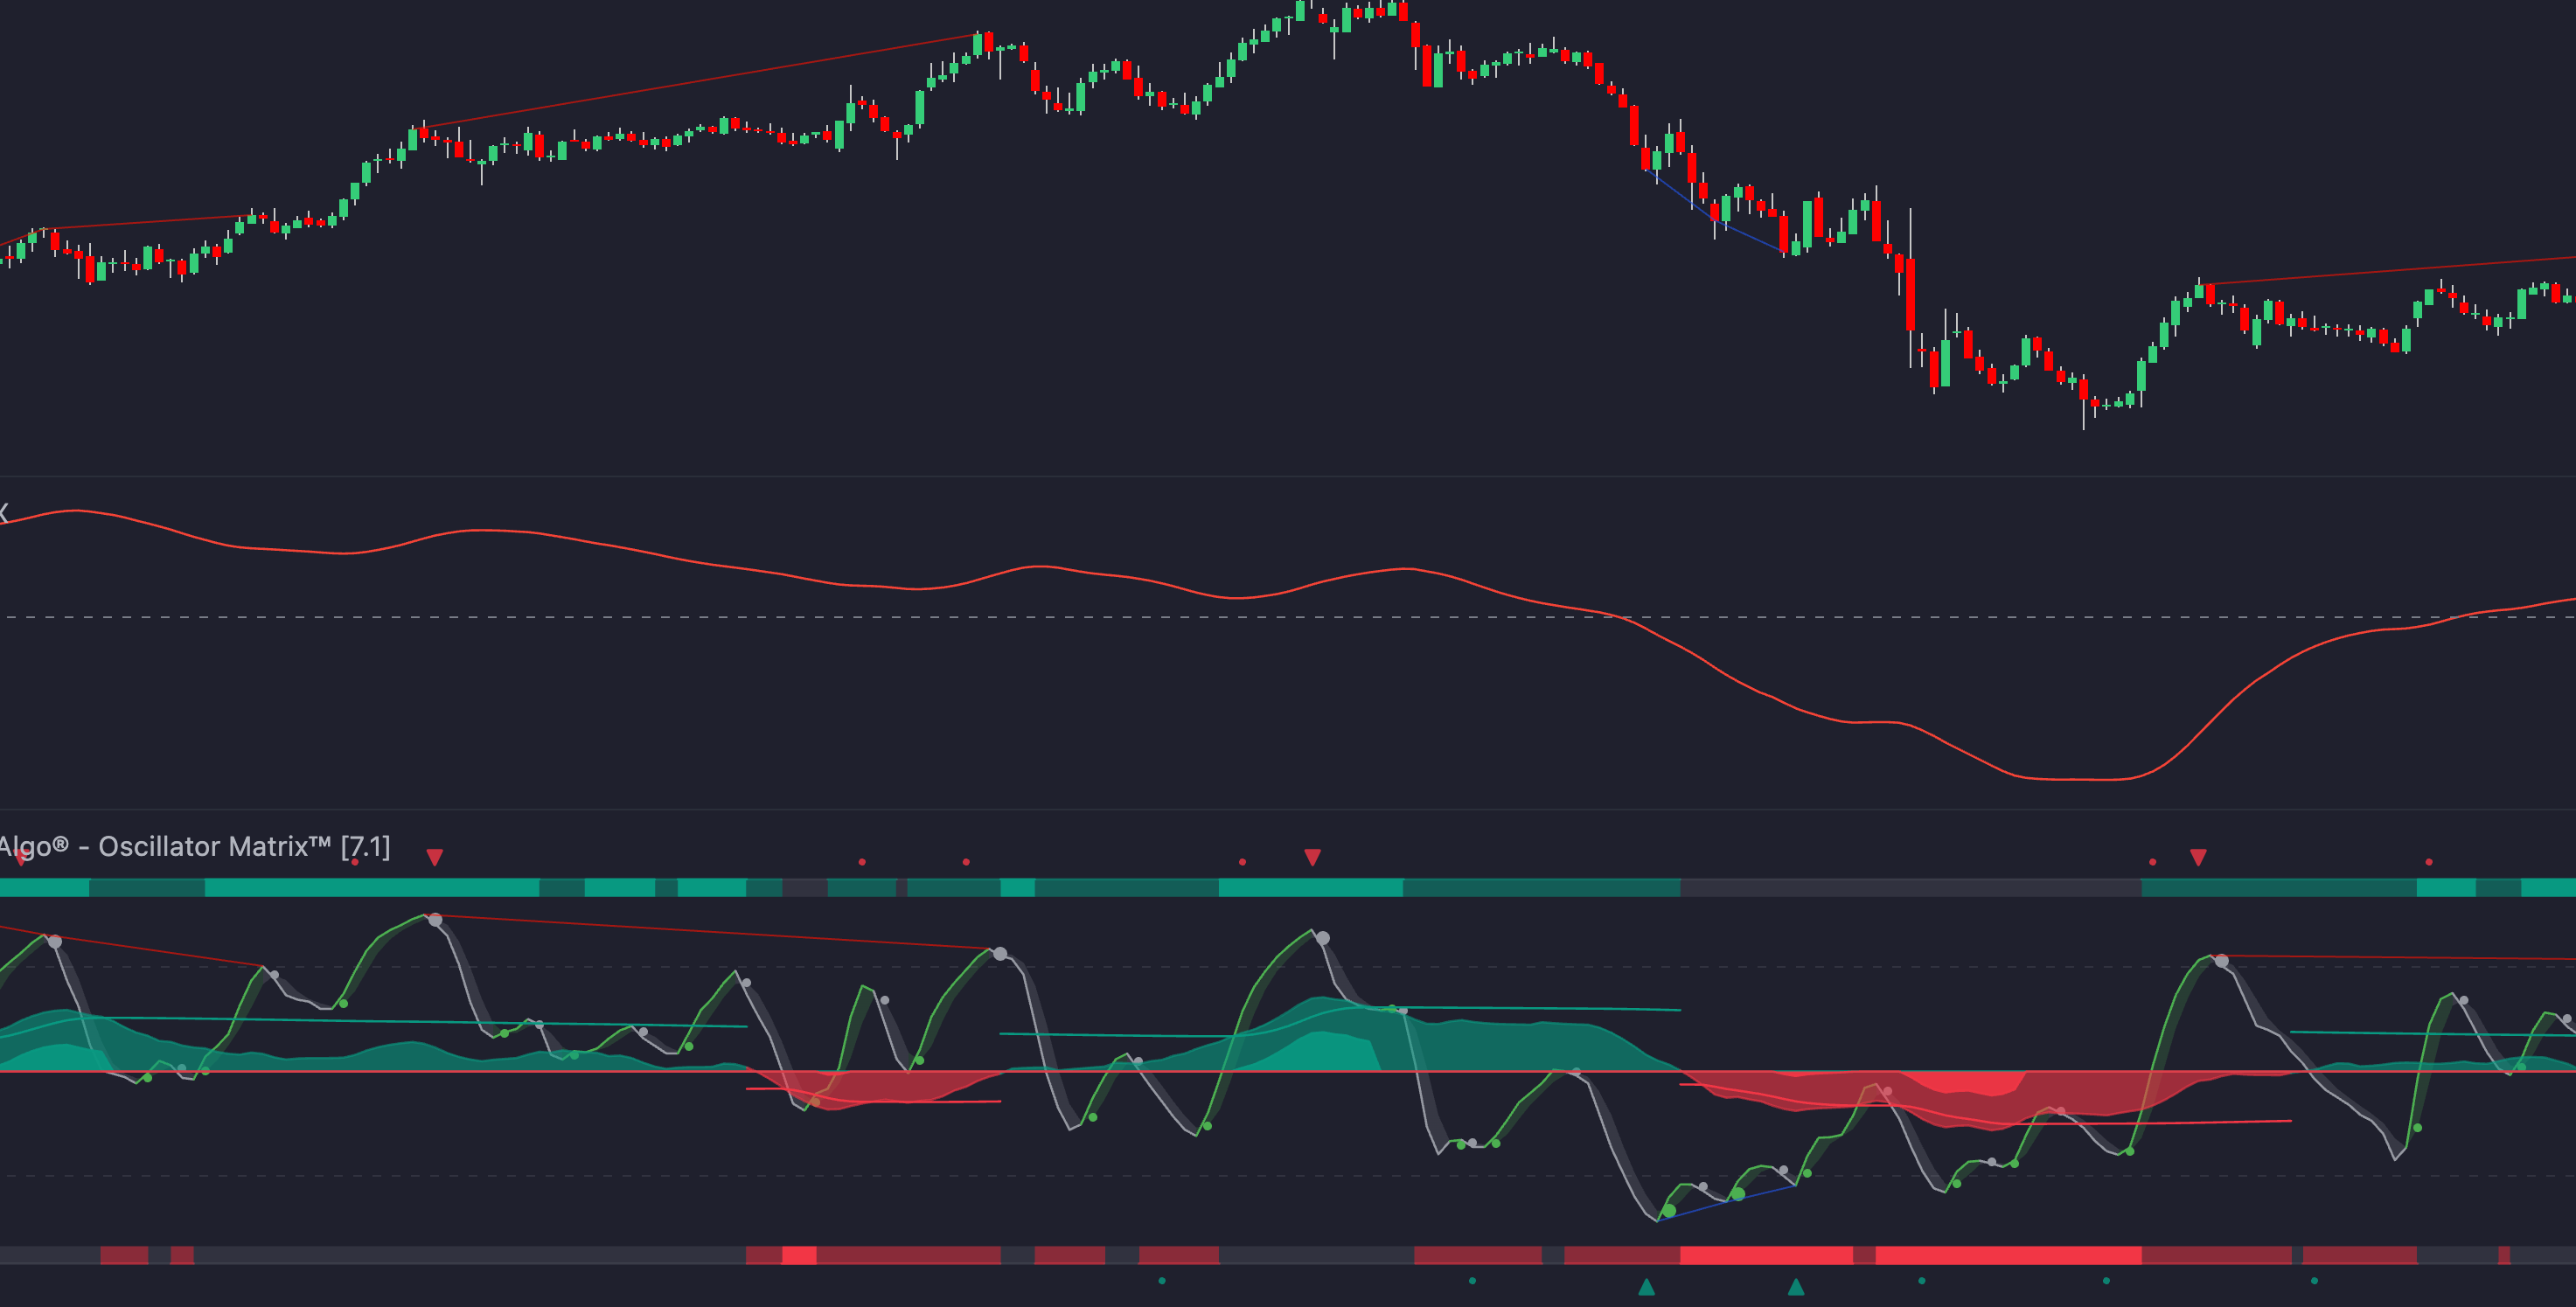
LuxAlgo provides advanced tools on TradingView that elevate TRIX analysis with real-time signals, visual overlays, and AI-powered strategy design.
LuxAlgo TradingView Integration
The Oscillator Matrix toolkit brings TRIX together with other momentum indicators, creating a unified dashboard for more comprehensive analysis.
Traders can pair TRIX signals with LuxAlgo's Signals & Overlays toolkit, which applies multiple signal algorithms to complement TRIX crossovers. For example, when TRIX crosses above the zero line, the toolkit highlights trend confirmations, adding another layer of validation to trading decisions.
Real-time alerts on TradingView notify traders of key TRIX signals, such as zero-line crossovers or divergence patterns. With LuxAlgo's Custom Alert Creator, available in its Premium plan, traders can script complex alerts by combining TRIX signals with price action insights.
The Price Action Concepts toolkit further enhances TRIX analysis by automatically identifying market structure changes that align with TRIX momentum shifts. This feature uncovers critical patterns and order blocks, giving traders a clearer context for their trades.
These tools seamlessly integrate into AI-driven strategy refinement, which we’ll explore next.
AI Backtesting for TRIX Strategies
LuxAlgo’s AI Backtesting Assistant transforms how traders develop and refine TRIX-based strategies. With access to a large database of backtested strategies, traders can quickly identify and implement optimized approaches. Learn more in our Backtesting overview.
"Our AI scans our most exclusive indicators to find the perfect strategy for you." – LuxAlgo AI Backtesting Assistant
The AI evaluates TRIX performance across different market conditions, timeframes, and asset classes. Whether you're trading forex, cryptocurrencies, or stock indices, you can request tailored strategies and receive ready-to-use code for TradingView.
Beyond basic adjustments, LuxAlgo’s optimization engine tests parameter combinations across multiple timeframes, refining TRIX strategies to help traders improve configurations over time.
"Our specialized AI makes improving LuxAlgo strategies simpler than ever before. Make your strategies better, seamlessly find new tweaks, and improve your win rate all directly on our platform." – AI Backtesting Assistant
LuxAlgo Tools for TRIX Analysis
Beyond integration and AI backtesting, LuxAlgo provides additional tools to enhance TRIX analysis. The LuxAlgo Universal Conditions Identifier (LUCID) combines multiple toolkits—such as the Oscillator Matrix, Signals & Overlays, and Price Action Concepts—into a single script, helping uncover relationships between TRIX signals and broader market trends.
"The LuxAlgo Universal Conditions Identifier fuses Signals & Overlays, Price Action Concepts, and Oscillator Matrix together into a single script. This built-in connector lets our AI—and you—mix conditions across every toolkit inside any Backtester, surfacing deeper synergies and uncovering more alpha in seconds." – AI Backtesting Assistant
These cross-toolkit integrations enhance trading signals, enabling traders to identify higher-probability setups compared to standalone TRIX analysis.
The Oscillator Matrix also plays a key role in refining TRIX signals. It detects real-time divergences across multiple oscillators, adding reliability to TRIX signals. For instance, if TRIX shows bullish divergence, the Matrix can confirm this with support from other momentum indicators.
Additionally, screeners within each toolkit allow traders to scan markets for TRIX setups that meet specific conditions. For example, the Oscillator Matrix Screener can pinpoint assets where TRIX is approaching a zero-line crossover while other indicators show favorable alignment.
For those seeking ongoing insights, weekly scanners and backtests—available in the Ultimate plan—provide continuous market analysis based on TRIX strategies. These features help traders adapt to changing market conditions effectively.
To top it off, LuxAlgo offers 24/7 live support so traders can configure advanced tools like LUCID with expert guidance whenever needed.
TRIX Pros and Cons
Understanding the strengths and weaknesses of TRIX can significantly enhance trading decisions.
TRIX Strengths
One of TRIX's standout features is its triple exponential smoothing, which reduces market noise and provides clearer trend signals. This is especially useful in volatile markets, where rapid price swings can create misleading signals [3].
Another advantage is its ability to identify divergences that can foreshadow trend reversals. TRIX is also highly adjustable—traders can modify the period length to fine-tune its sensitivity, aligning it with their preferred trading style and timeframe [11].
TRIX can offer early warnings via zero-line and signal-line crossovers, as well as divergences.
TRIX Weaknesses
Despite its benefits, TRIX has drawbacks. Since it’s based on moving averages, it can lag behind actual price movements, which may delay entries and exits during rapid market reversals. In sideways or choppy markets, it can also produce false signals, potentially leading to whipsaw effects if traders don’t use additional confirmation tools.
Moreover, its calculation and parameter adjustments can be complex, requiring thorough backtesting and experience to use effectively. For this reason, TRIX works best when combined with other technical analysis tools to improve accuracy [3].
TRIX Pros vs Cons Comparison
| Advantages | Limitations |
|---|---|
| Reduces market noise with triple smoothing | Can lag, delaying responses to rapid price changes |
| Detects divergences signaling early trend reversals | May produce false signals in choppy or sideways markets |
| Customizable to match various timeframes and trading styles | Complex calculations can challenge beginners |
| Provides signals ahead of price movements | Requires careful parameter optimization |
| Offers multiple signal types for diverse market analysis | Best used alongside other technical tools |
| Helps identify meaningful trends over random fluctuations | May miss quick reversals due to smoothing effects |
Note: Combining indicators can sometimes improve decision-making, but results vary by asset and timeframe. Always validate with thorough AI Backtesting before relying on live trades.
Conclusion
Building on the strategies and analysis discussed earlier, the TRIX indicator stands out as a reliable tool for cutting through market noise and identifying genuine trends. By filtering out unnecessary fluctuations, it provides clear signals for trend direction, momentum changes, and potential reversals.
Key Takeaways
This guide has shown how TRIX's unique calculation makes it a dependable oscillator in volatile markets. Its ability to generate zero-line crossovers for confirming trends, highlight divergences for early reversal signals, and adapt to various timeframes makes it a valuable asset for both short-term and long-term traders.
Pairing TRIX with other indicators can further refine your trading strategy. For example, combining TRIX with moving averages can strengthen trend confirmation, while using it alongside volume indicators can validate signals. This flexibility allows for a well-rounded and informed trading approach. With these tools and insights, TRIX can now become an integral part of your trading toolkit.
Starting with TRIX
Interested in implementing TRIX in your strategy? You can begin by exploring LuxAlgo’s exclusive tools on TradingView, which offer a seamless way to integrate this indicator into your trading routine. With TradingView integration, these tools provide enhanced TRIX analysis that goes beyond standard applications.
LuxAlgo’s AI Backtesting Assistant and integrated TradingView features help you fine-tune TRIX strategies to match your trading style. This data-driven approach enables you to optimize settings and discover effective combinations for success.
For advanced analysis, LuxAlgo’s Oscillator Matrix toolkit is a game-changer. Alongside its PAC Backtester and OSC Screener, this toolkit helps you identify promising setups and evaluate performance using historical data.
FAQs
How can I use the TRIX indicator with other tools to improve my trading strategy?
To get the most out of the TRIX indicator, try combining it with other technical analysis tools. Pairing TRIX with momentum oscillators like the RSI or MACD can provide extra confirmation for trend reversals and help spot overbought or oversold conditions. This combination can make the signals more dependable.
Another way to enhance your approach is by using TRIX alongside support and resistance levels or chart patterns. These tools can help you fine-tune the timing of your entries and exits. Additionally, integrating TRIX with trend-following tools like moving averages or trend lines can help filter out false signals and confirm the market's overall direction. Together, these strategies can make TRIX a valuable part of a well-rounded trading plan.
How can I adjust TRIX settings to match my trading style and market conditions?
To customize the TRIX indicator for your trading style, tweak the number of periods to match your objectives. If you're targeting long-term trends, increasing the periods can help smooth out price noise and highlight broader market movements. On the other hand, for short-term trading, reducing the periods makes the indicator more sensitive to recent price changes.
In markets with clear trends, using longer periods often results in more consistent signals. Meanwhile, in volatile conditions, shorter periods can be useful for spotting rapid momentum shifts. Make sure to backtest your adjustments to confirm they work well with your strategy and the market you're analyzing.
How does the TRIX indicator reduce market noise compared to traditional moving averages?
The TRIX indicator employs a method called triple exponential smoothing, layering three levels of smoothing onto price data. This technique minimizes short-term price fluctuations and market noise, making it simpler to spot the true trend beneath the surface.
Unlike traditional moving averages, TRIX is less sensitive to small price movements. This helps filter out misleading signals, enhancing the accuracy of its momentum-based indications. It's especially handy in highly volatile markets, where traditional moving averages can often produce signals clouded by noise.
References
LuxAlgo Resources
- TRIX (Triangular Momentum Oscillator with Real-Time Divergences)
- Breakouts with Tests & Retests
- Machine Learning Moving Average
- Trending Market Toolkit
- Understanding Moving Averages
- Oscillator Matrix: Reversal Signals (Docs)
- AI Backtesting: Fetching Strategies (Docs)
- Volumetric Toolkit
- Signals & Overlays: Alerts (Docs)
- Custom Alert Creator: Update & Actions
- Price Action Concepts: Market Structures (Docs)
- AI Backtesting Assistant (Main Page)
- AI Backtesting Overview
- PPF (Oscar Ramos)
- Battle Signals
- Oscillator Matrix Toolkit
- Signals & Overlays Toolkit
- PAC Backtester
- OSC Screener
- Pullback Trading vs. Trend Reversals
External Resources
- What Is an Exponential Moving Average?
- StockCharts
- TradingView: TRIX Support Article
- Zerodha Kite
- StockCharts ChartSchool: TRIX
- HowToTrade: TRIX Indicator
- StockManiacs: TRIX Indicator
- AvaTrade: TRIX Strategies
- TEMA vs. Other Smoothing Methods
- Morpher: TRIX Guide
- Warrior Trading: TRIX
- Moomoo Learn: TRIX
- Angel One: TRIX Indicator
- Investopedia: Triple Exponential Moving Average (TRIX)
- TradingView: Indices Market Overview
- CME Group: Technical Analysis Education


