Ultimate Guide to Technical Analysis Tools for Crypto Trading
Technical analysis gives crypto traders a way to describe trends, momentum, volatility and trading activity using explicit rules. It does not make prices predictable or guarantee profitable trades. The useful starting point is a consistent market, data source and research question—not the largest collection of indicators.
This guide compares charting platforms, explains the major indicator families and shows how to build a testable plan. Crypto trades around the clock, but liquidity, fees and prices differ across venues. A BTC spot chart and a perpetual-futures chart are different instruments, even when their prices usually move together.
Choose a Platform for the Job
Separate market research, chart analysis, strategy evaluation and order execution. A platform can support several of these tasks without making them interchangeable. Check the exact symbol, exchange, product type and account eligibility before relying on a feature.
| Platform | Useful role | What to verify |
|---|---|---|
| LuxAlgo | Native charts, Library implementations and strategy research with Quant | Supported market data and features; inspect code and run strategies manually |
| TradingView | Charts across available exchange feeds, indicators and scripts | Exact symbol and exchange, plan limits and any separate trading connection |
| Coinbase Advanced | Exchange trading interface with charts and order books | Available pairs, jurisdiction, order types and account-specific fees |
| CoinMarketCap | Market overview, rankings, asset research and historical context | Data methodology and the underlying venue; an overview price is not an executable quote |
Start with LuxAlgo’s native data coverage when choosing a crypto chart. Use the exchange shown for the symbol and keep spot and derivatives separate. Indicators calculated from different venues can disagree because the underlying prices and volumes differ.
Coinbase Advanced combines exchange order books and trading with TradingView-powered charts. That embedded charting interface is distinct from subscribing to TradingView or using LuxAlgo’s native platform. CoinMarketCap is useful for broader market context, while TradingView provides another charting and script workflow. Feature availability and execution permissions need to be checked separately.
Understand What Each Indicator Measures
| Family | Examples | Useful question | Main limitation |
|---|---|---|---|
| Trend | SMA, EMA, Ichimoku, KAMA | How is price behaving relative to a defined trend reference? | Lag, whipsaws and parameter dependence |
| Momentum | RSI, MACD | How are recent changes or moving-average relationships evolving? | Momentum can stay extreme; MACD has no universal overbought level |
| Volatility | Bollinger Bands, ATR | How dispersed or wide-ranging has price been? | Volatility does not specify future direction |
| Volume and price | OBV, VWAP | How does this venue’s volume relate to price? | Neither identifies participants or proves institutional intent |
Moving Averages and Ichimoku
An SMA averages a chosen price over a fixed number of bars. An EMA puts more weight on recent observations. Both can organize a trend rule, such as price above an average or a fast average above a slow one, but neither calculated line is a guaranteed support level.
A conventional golden cross compares the 50-day and 200-day moving averages, commonly SMAs. You can investigate an EMA version, but name it explicitly. A crossover confirms the relationship between those series at that moment; it can arrive late or reverse repeatedly in a range. A 50-period average on an hourly chart is not a 50-day average.
Ichimoku combines high–low midpoint calculations and displaced reference lines. Price above or below the cloud can define trend context, while the conversion/base relationship supplies another condition. Specify the settings and the plotted time alignment. A cloud drawn forward is a projection of calculations already available, not knowledge of future prices. Avoid using later-confirmed information as though it were known on the earlier bar.
RSI, MACD and Bollinger Bands
RSI compares smoothed gains with smoothed losses, conventionally over 14 bars. Levels such as 30 and 70 describe conventional oversold and overbought readings; they do not require an immediate reversal. An extreme can persist during a sustained move.
Conventional MACD subtracts a 26-period EMA from a 12-period EMA, with a 9-period EMA signal and a histogram equal to their difference. A signal-line crossover differs from a zero crossover. MACD is expressed in price units and is not bounded like RSI, so there is no universal overbought or oversold number across crypto assets.
Bollinger Bands are a price overlay, commonly a 20-period SMA with bands two standard deviations away. Narrow bands describe low dispersion under that calculation, not a forecast of breakout direction. A band touch is not automatically an entry, and two standard deviations do not guarantee 95% future containment. See John Bollinger’s rules for these distinctions.
OBV and VWAP
OBV adds the whole bar’s volume when its close rises, subtracts the whole volume when it falls, and carries the total forward when closes are equal. It is a coarse close-direction assignment, not a classification of actual buyer-initiated and seller-initiated trades. Its raw level also depends on the starting history.
VWAP divides accumulated price-times-volume by accumulated volume over a defined session or anchor. Candle-based implementations approximate this using a representative bar price. In a 24-hour crypto market, define the session boundary and time zone instead of assuming that every platform resets at the same moment.
Price above VWAP or rising OBV can be part of a research hypothesis. Neither reveals institutional ownership or guarantees trend continuation. Verify whether volume is measured in base units, quote units or contracts, and whether the chart represents one exchange or an aggregate. Keep that definition consistent.
Advanced Analysis Without Adding Unnecessary Complexity
KAMA Adapts to Directional Efficiency
Kaufman’s adaptive moving average changes its smoothing weight using an efficiency measure: absolute net movement divided by the sum of absolute bar-to-bar movements over the window. A direct path has higher efficiency than a path that repeatedly reverses. This is more specific than simply saying KAMA tracks volatility.
The efficiency value is mapped between fast and slow smoothing constants and squared before updating the average. Specify the lookback, constants, initialization and handling of a flat window. KAMA can still lag a new move and generate false crossings; adapting its weight is not proof that it outperforms a fixed average.
For multiple-timeframe analysis, define which completed higher-timeframe value is available at the entry decision. An unfinished daily candle can change while an intraday chart is open. Adding more timeframes does not automatically add independent evidence.
Distinguish Order Books, Volume Profiles and Footprints
| Display | What it represents | What it cannot establish |
|---|---|---|
| Order book | Displayed resting bids and asks on a particular venue | That orders will remain or execute; hidden liquidity and other venues are absent |
| Bid–ask spread | Difference between the best displayed ask and bid | The identity or intentions of participants, or full execution cost for a large order |
| Volume profile | Historical volume distributed across price levels | A live inventory of resting limit orders |
| Footprint | Executed activity grouped by price and time under the data provider’s classification | A complete market-wide order book or a guarantee that an imbalance will continue |
Displayed orders can be changed or canceled before a trade reaches them. A narrow top-of-book spread can coexist with limited depth, and a larger market order may trade through several levels. Historical high-volume areas describe activity in the selected sample; they are possible context for a rule, not barriers that price must respect.
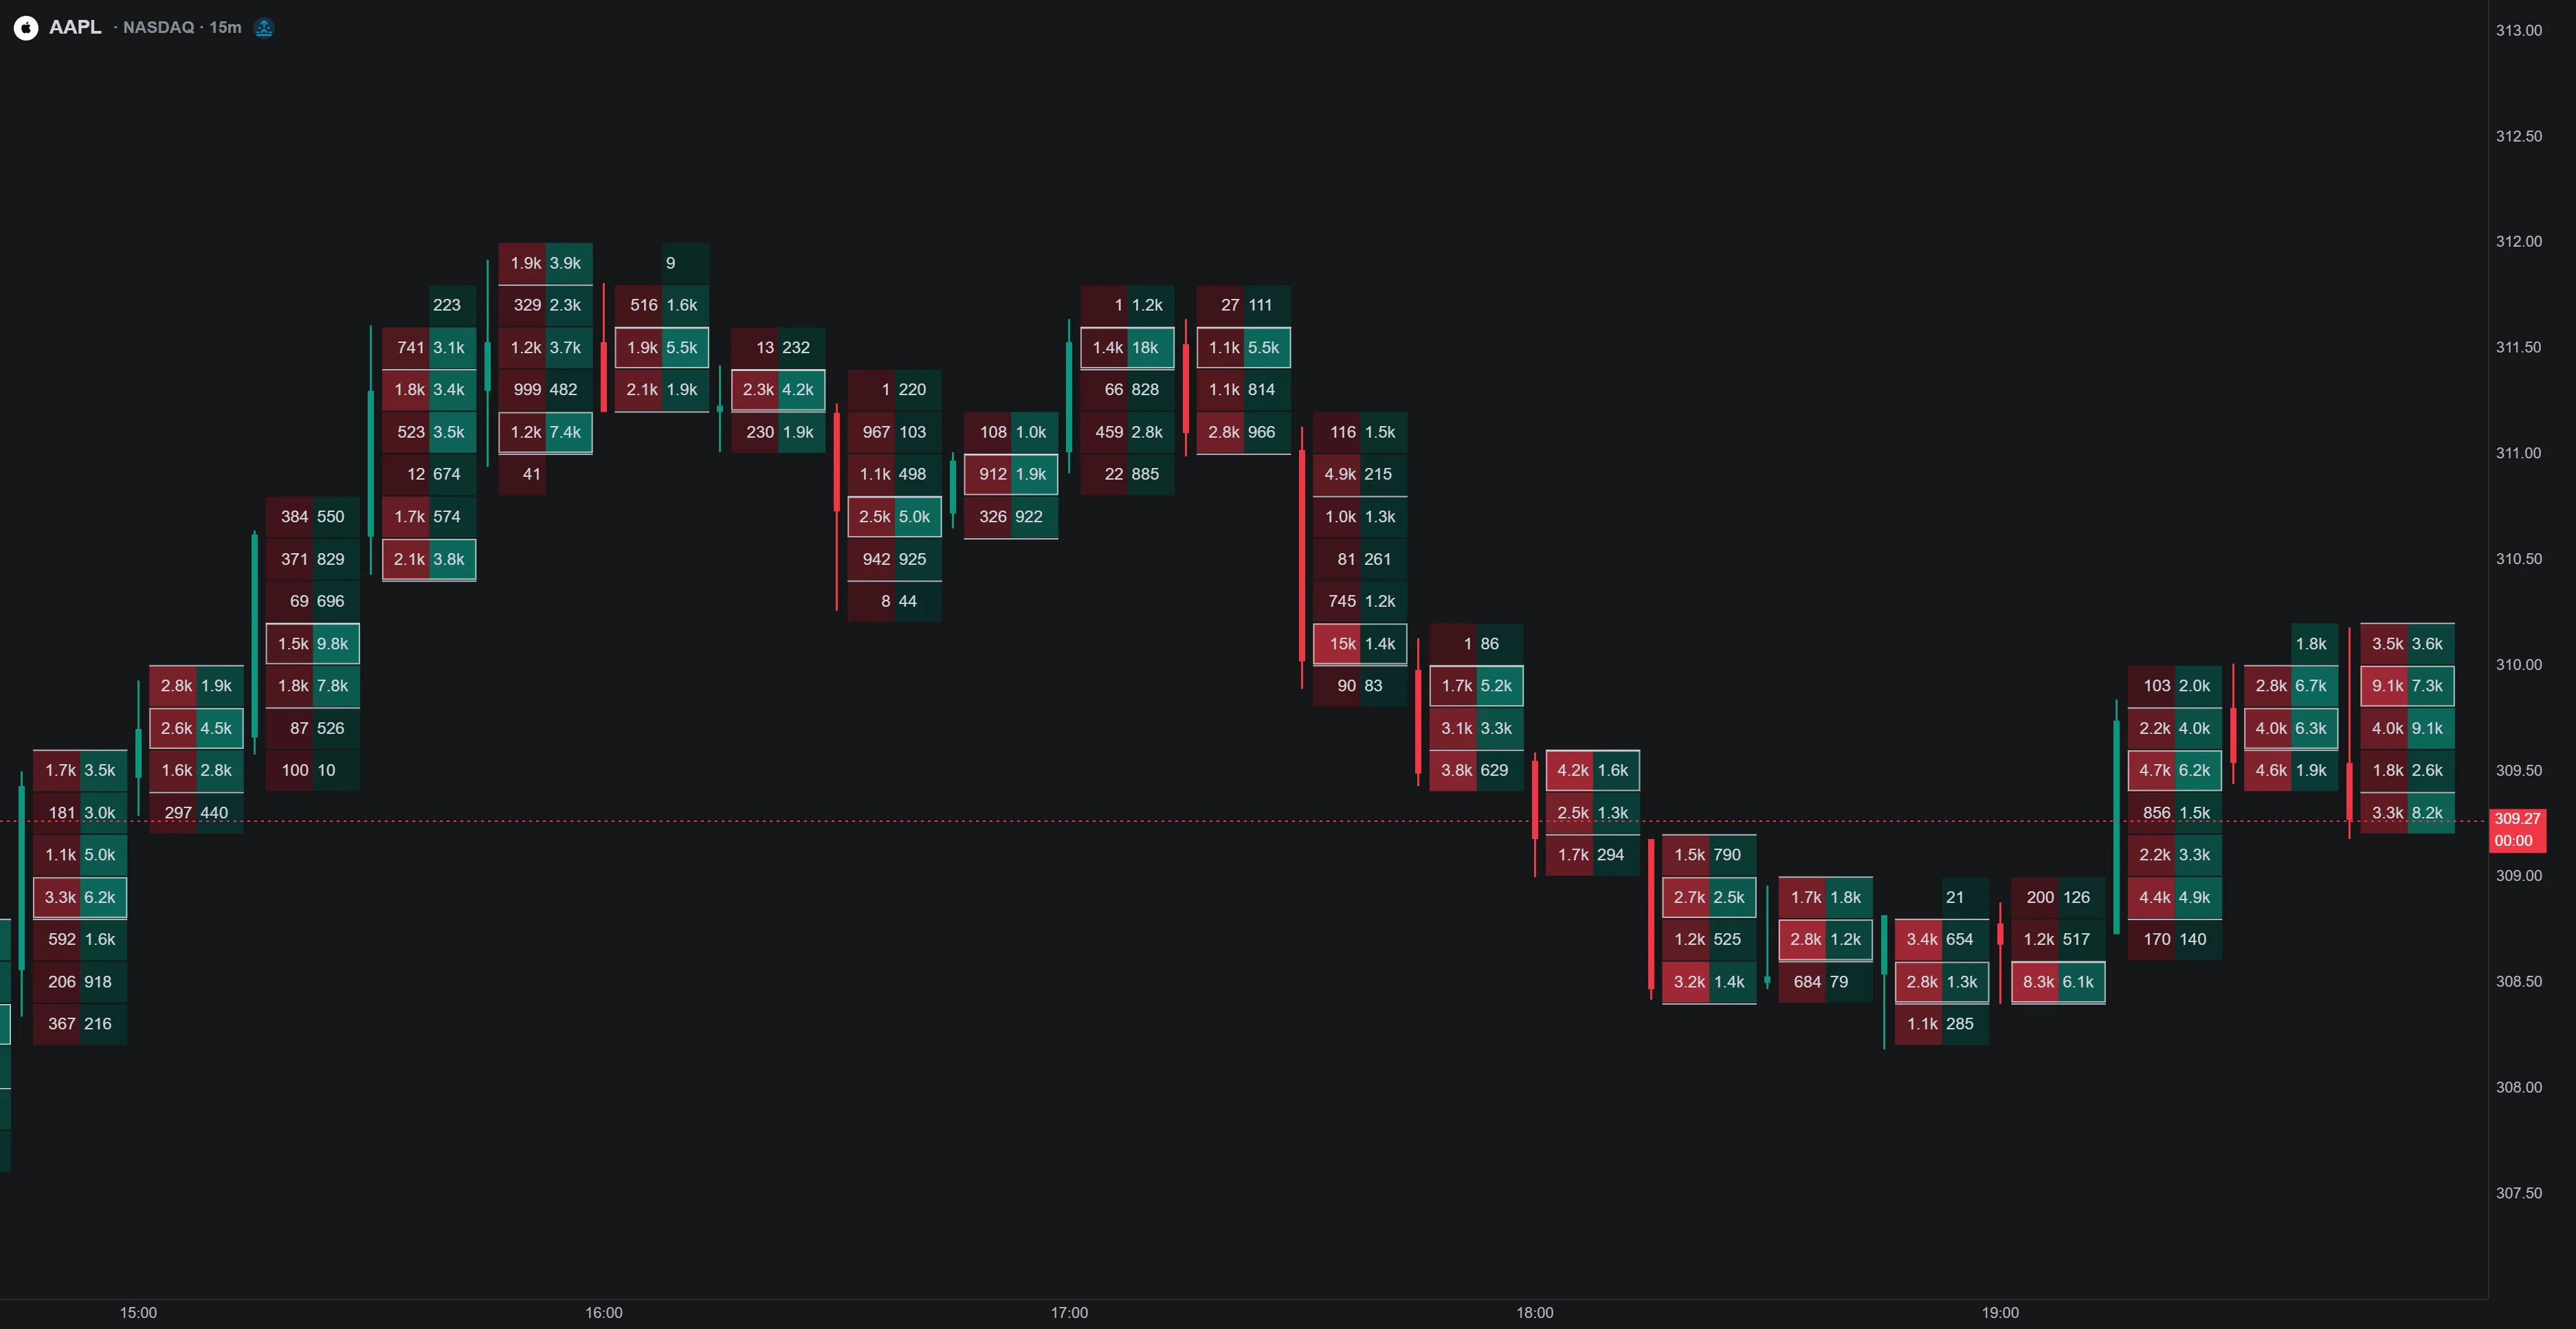
LuxAlgo’s supported native crypto footprints use aggregated executed trade data. Check the current coverage documentation for the symbol and available analytics. Do not assume a candle-based volume profile, an exchange order book and an executed-trade footprint answer the same question.
Build a Crypto Trading Plan You Can Evaluate
Add One Condition at a Time
Start with a simple entry, adverse exit and target or time exit. Then investigate one additional filter. For example, compare a moving-average trend condition alone with the same rule plus RSI. Keep the exit and evaluation period unchanged so the difference is interpretable.
- A trend-and-volume question: compare Ichimoku context with and without a defined OBV condition, using the same exchange feed.
- A volatility question: evaluate a Bollinger breakout rule with a predefined ATR-based exit; neither component selects the direction in advance.
- A price-and-volume question: compare a price setup with and without a VWAP location filter, fixing the anchor and session boundary.
Agreement between indicators is not independent confirmation when they reuse the same price history. Record losing trades, missed fills and drawdowns. Reserve later data for evaluating unchanged rules, and avoid continually changing parameters to explain the most recent loss.
Use ATR and Position Size Together
ATR smooths true range, which accounts for the bar’s range and its distance from the previous close. It measures movement size, not direction. An ATR multiple can define an exit distance to investigate, but the position size must also reflect the amount you are prepared to lose under the planned execution assumptions.
For a simple spot example, suppose an entry is $100, a planned adverse exit is $95, and the hypothetical loss allowance is $50. Before fees and slippage, $50 divided by the $5 distance gives 10 units, with a $1,000 notional purchase. Trading costs reduce the size compatible with that allowance, and a worse fill can increase the realized loss. These numbers illustrate arithmetic, not recommended trade settings.
A universal 1–2% risk rule is not appropriate for every account or strategy. Account for correlated positions, concentration, liquidity and a sequence of losses. Perpetuals also require contract specifications, funding and liquidation mechanics; a spot sizing formula cannot be copied blindly into an inverse or leveraged contract.
Fibonacci levels drawn from chosen swings can define candidate targets, but the anchors and the timing of their identification must be explicit. A plotted target is not a promised destination. Compare the planned reward with the adverse distance and costs, then evaluate the entire rule rather than selecting attractive historical examples.
Separate Automation from Execution Reliability
A script can make rules repeatable. It does not guarantee fills or remove operational risk. A market order can execute away from the displayed price; a limit or stop-limit order may not fill. Any live integration needs venue-specific order handling, connection monitoring and reconciliation with actual fills. A backtest or alert is not itself a completed exchange order.
Research the Strategy in LuxAlgo’s Native Platform
Use the Library to inspect a supported implementation, then ask Quant, our coding agent to express the research rules. Include the instrument, interval, completed-bar timing, entries, exits and costs. Inspect the generated code and run it manually.
Review strategy settings and individual trades using standard candle prices. Include commissions, spread and slippage assumptions; add relevant funding or holding costs when the evaluation supports them, and disclose any omitted cost. Check later periods and different conditions without promising that past results will repeat.
Frequently Asked Questions
What are the most effective technical analysis tools for crypto?
There is no universal best set. Begin with a consistent exchange feed and a simple rule, then evaluate whether each trend, momentum, volatility or volume condition improves that rule after costs on later data.
Does VWAP reveal institutional buying?
No. VWAP is a volume-weighted price reference over a defined window. It does not identify who traded or why.
Is a volume profile the same as an order book?
No. A volume profile summarizes historical volume by price. An order book displays resting bids and asks that can change or be canceled.
Does KAMA automatically work better in volatile markets?
No. KAMA adapts its smoothing to directional efficiency, but still depends on settings and can lag or produce false crossings.
Can a successful backtest guarantee live crypto results?
No. Data selection, timing, costs, fills and changing conditions can make live results differ. Inspect the rules, evaluate later data and distinguish simulated orders from actual execution.
Read next