
Want to turn your trading ideas into automated systems? Here is a practical 2026 workflow for moving from a market idea to a live, rules-based strategy.
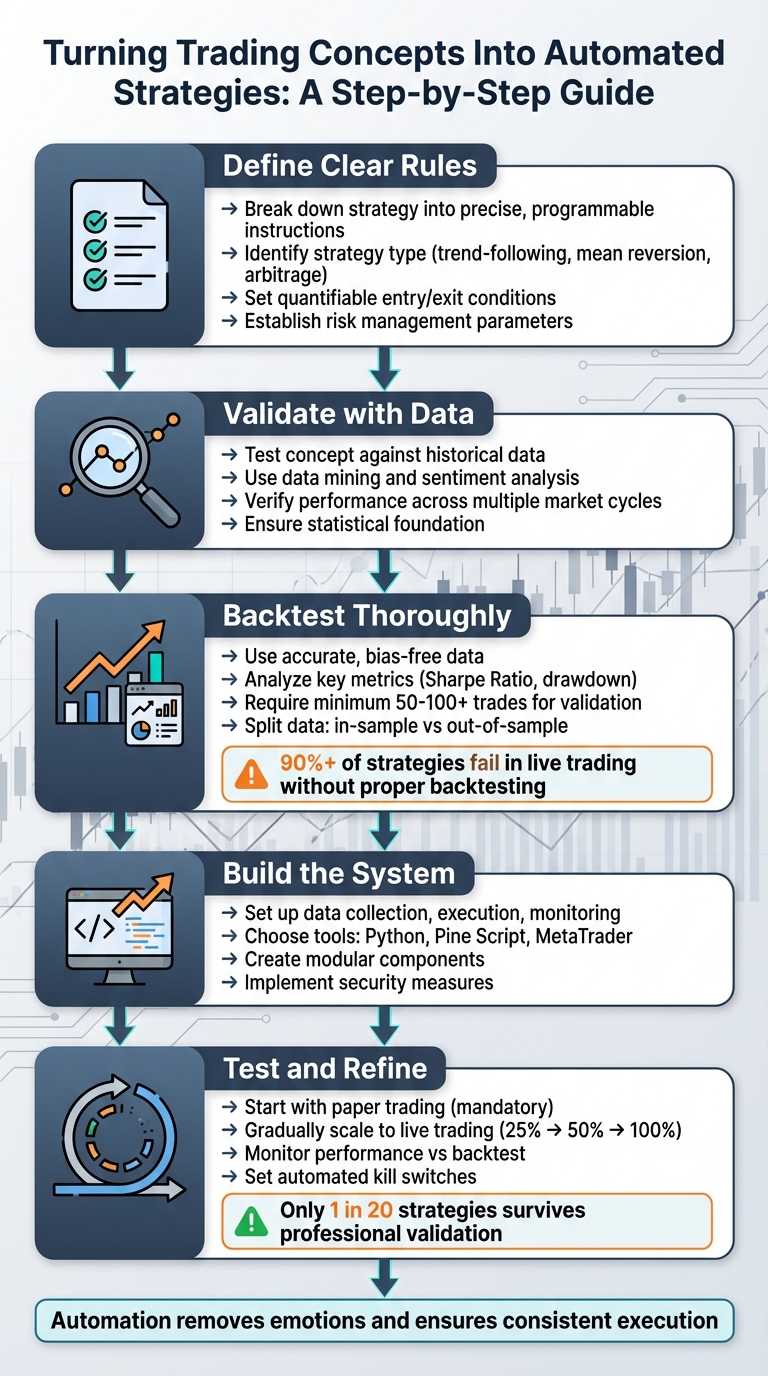
- Define Clear Rules: Break your concept into precise, programmable instructions. Computers need exact logic, not intuition.
- Validate with Data: Check whether the idea holds up across different market regimes, instruments, and timeframes.
- Backtest Thoroughly: Use realistic assumptions for spreads, commissions, slippage, and execution timing while tracking metrics such as Sharpe ratio, profit factor, and drawdown.
- Build the System: Set up data, signal generation, order routing, monitoring, and fail-safes. Common choices include Python, Pine Script, and MetaTrader 5.
- Test and Refine: Start with paper trading, then scale into live execution gradually while monitoring drift between backtest and live results.
Automation can reduce emotional decision-making and improve consistency, but only when the rules, testing, and deployment workflow are robust. If you are building TradingView logic, LuxAlgo Quant can help turn plain-English trading ideas into Pine Script indicators or strategies faster, then validate and refine the logic before deployment.
Define Your Trading Concept and Rules
The first step in automated trading is to clearly define your rules. This removes ambiguity and ensures that your trading idea can be translated into precise, testable instructions. Computers do not work on intuition; they require exact logic. A vague idea like "buy when momentum looks strong" is not enough. Instead, you need rules a machine can evaluate bar by bar, such as specific thresholds, timeframes, and invalidation criteria. Traders who build on TradingView often prototype this logic in Pine Script first, and Quant is especially useful when you want to convert a chart concept or natural-language workflow into a structured script without starting from a blank page.
Start by identifying your core strategy type. Are you focusing on trend-following, mean reversion, breakout trading, statistical arbitrage, or perhaps a hedged approach such as delta-neutral arbitrage? Each style comes with different signal logic, holding periods, and risk parameters. For example:
- A trend-following approach might trigger a buy when a 50-day SMA crosses above a 200-day SMA.
- A mean reversion strategy could activate when the RSI dips below 30 while the price touches the lower Bollinger Band.
Set Clear Trading Rules and Goals
Every automated strategy needs well-defined "if/then" commands to specify when to enter, exit, and manage risk. These commands must be precise enough for programming. For instance, swap vague instructions like "exit when profit looks good" with something measurable, such as "sell when price rises 3% above entry or falls 1.5% below entry."
Your entry and exit conditions should rely on quantifiable parameters. Here’s an example:
- Entry rule: If RSI < 30 and BB% < 0, then buy 100 shares.
- Exit rule: If RSI > 70 or price hits a 5% stop-loss, then sell.
The table below shows how different indicator combinations can be turned into specific trading signals:
| Indicator Combination | Buy Signal | Sell Signal | Risk Level |
|---|---|---|---|
| RSI + Bollinger Bands | RSI < 30 AND BB% < 0 | RSI > 70 AND BB% > 100 | Moderate |
| Moving Averages | Short MA crosses above Long MA | Short MA crosses below Long MA | Low |
| MACD + RSI | MACD crosses up AND RSI < 40 | MACD crosses down AND RSI > 60 | High |
Risk management is just as important as entry signals. Decide on your position sizing formula, maximum drawdown limits, and stop-loss strategy before coding begins. For example, will you risk 2% of your capital per trade? Will you use a trailing stop that adjusts as price moves? These decisions determine how your system behaves under stress.
Once your rules and risk parameters are in place, the next step is to validate the strategy with data.
Generate and Validate Strategy Ideas
Good strategy ideas can come from market observations, academic studies, or patterns found in historical data. Maybe you have noticed that certain stocks repeatedly react near support, that post-earnings moves mean-revert under specific conditions, or that volatility compression often precedes expansion. The key is to document those observations in enough detail to test them properly rather than relying on memory or a few screenshots.
Before writing any code, validate your idea through thorough research. That can include descriptive statistics, event studies, market regime analysis, and broader algorithmic trading research. If your workflow includes coding indicators or strategies for TradingView, LuxAlgo Quant can help generate, debug, and refine Pine Script logic as you test different hypotheses.
"A bot is only as good as the strategy it follows. Without understanding how and why it works, you are handing your capital to a black box."
It is also important to consider how the strategy behaves in different market conditions. A method that works in high-volatility crypto markets may fail in quieter equity environments, while a system designed for trending futures markets may struggle in range-bound conditions. That is why strategy validation should cover more than one market regime before you move to backtesting and deployment.
Once the idea has a sound basis, you can backtest it against historical data to see whether the edge is durable enough to justify further development.
Backtest Your Strategy with Historical Data
Once you have outlined your trading rules, it is time to backtest them using historical data. This step helps you determine whether the strategy has a statistical edge or whether the apparent opportunity is mostly noise, curve fitting, or favorable hindsight.
The success of backtesting depends on both data quality and realistic assumptions. If your data is flawed, your costs are understated, or your execution logic uses information that would not have been known in real time, the results can look far better than reality. Serious validation includes spread, commission, slippage, and clear assumptions about whether signals are evaluated at the close, next open, or intrabar. This is what separates a robust system from a lucky historical fit.
Choose and Prepare Historical Data
The backbone of any effective backtest is high-quality historical data. Errors, bad corporate-action adjustments, or symbol mapping issues can distort results enough to invalidate the entire exercise. You can source data from brokers, specialist vendors, exchanges, or market data platforms such as Cboe BZX for certain equity datasets and CoinAPI for digital assets. Free sources can still be useful for research, but you need to understand their limits, especially survivorship bias, stale fields, and missing intraday depth.
The time span of your data should align with your strategy type:
- Short-term and trend-following strategies (holding periods under a week): often benefit from at least 10 years of data.
- Long-term position strategies (holding periods over a month): usually need a deeper sample that includes multiple market cycles.
- Intraday strategies: often require enough high-resolution data to capture changes in volatility, liquidity, and spread conditions.
The goal is to test the strategy across different environments, including bull markets, bear markets, and sideways conditions.
It is also essential to split your data into in-sample data for research and optimization and out-of-sample data for validation. Many traders also use walk-forward analysis so the strategy is repeatedly optimized on one segment and tested on the next. That workflow is closer to how a strategy evolves in production and helps reveal whether the edge is stable or fragile.
Be cautious of look-ahead bias, which happens when future information is unintentionally used to make past decisions. For example, using a bar’s closing price to trigger an entry at that same bar’s open is unrealistic because the close would not have been known at the time. Errors like these can make an unprofitable strategy look deceptively strong.
Measure Results with Performance Metrics
To evaluate your strategy, rely on specific performance metrics rather than headline return alone. As a rule of thumb, more observations are better: 50 trades may be enough to start learning, but 100 or more usually gives you a more dependable read on whether the edge is persistent. The right sample size still depends on the strategy horizon, turnover, and distribution of returns.
Pay attention to these key metrics:
| Metric | Good Benchmark | What It Measures |
|---|---|---|
| Sharpe Ratio | Above 1.0 (2.0+ is excellent) | Risk-adjusted return |
| Maximum Drawdown | Below 20% | Largest peak-to-trough decline |
| Profit Factor | 1.5 or higher | Gross profit divided by gross loss |
| Expectancy | Positive value | Average gain per trade |
The Sharpe Ratio is useful because it evaluates returns relative to risk. Maximum drawdown shows the worst peak-to-trough decline, which matters because even a profitable system can be abandoned if its losses are psychologically or financially too difficult to tolerate. Profit factor helps you see whether the edge is wide enough to survive real-world friction.
For further validation, consider walk-forward analysis, where you optimize the strategy on one segment and test it on the next. Repeating that process better mimics real-world deployment.
"If you torture the data long enough, it will confess to anything."
Out-of-sample degradation is common, which is why rigorous validation matters. For traders who want a faster workflow, LuxAlgo’s AI Backtesting Assistant can help explore and compare strategies across assets and timeframes, while the documentation explains how the platform handles strategy retrieval, testing, and evaluation.
A well-executed backtest confirms your strategy’s potential and lays the groundwork for further development.
Build the Automated Trading System
Once you have validated your strategy through backtesting, the next step is to build the technical framework for automated trading. That means creating a system that can handle market monitoring, signal generation, order execution, logging, and safety controls without constant manual supervision. A well-designed architecture keeps these components modular so you can diagnose issues, replace providers, and upgrade individual pieces without rewriting everything.
The data collection component gathers real-time and historical market data from providers such as Polygon.io, Alpha Vantage, or broker feeds. The strategy engine processes that data and generates buy or sell signals based on your rules. The execution engine then routes orders through brokers or exchanges such as Alpaca, Interactive Brokers, or Binance where permitted. Finally, the monitoring and logging layer tracks positions, latency, fills, and system errors so you can tell whether the live system is behaving as expected.
For users of TradingView alerts, a webhook middleware acts as the bridge between the charting layer and your broker or execution service. When a strategy triggers an alert, it can send JSON payloads such as {"action":"buy","symbol":"AAPL"} to a secure endpoint that your middleware validates before forwarding to the broker. This architecture is common because Pine Script is excellent for signal generation, while execution and broker-specific risk checks usually live outside TradingView.
To improve reliability, many traders run their systems on a VPS or cloud instance so they can stay online 24/7 and continue operating during local outages. Process managers such as systemd or PM2 can restart failed services automatically, while a kill switch can stop new orders if your daily loss limit, max drawdown, or connectivity checks are breached.
Design System Architecture and Components
With your strategy ready, structure the system in modular layers. The Signal Engine houses the trading logic, the Position Sizing Engine determines exposure, the Risk Management Layer enforces limits, the Execution Engine handles fills and retries, and the Monitoring/Diagnostics Layer logs what happened and why. This often includes stress testing for trading strategies so the system is evaluated under volatile and abnormal conditions before capital is scaled.
For scalability, you can use a server-client model where a central server handles the broker connection while trading bots communicate through a message bus like Redis. This setup allows you to run multiple strategies without overloading a single process. When setting up webhook messages, use JSON payloads, include a secret token for validation, and decide whether the alert should trigger intrabar or only "Once Per Bar Close" based on how the strategy was tested.
Security is crucial. Use HTTPS encryption for webhooks, restrict API access, and implement checks that prevent duplicate orders or stale signals from being executed.
"If your system requires frequent human intervention, it is not automated; it is discretionary trading with extra moving parts."
Keeping your system simple reduces failure points and makes debugging much easier.
Select Programming Languages and Platforms
The programming language and platform you choose should match your technical skill, deployment target, and execution needs. For most retail and independent systematic traders, the practical shortlist is Python, Pine Script, and MetaTrader, with each excelling at different parts of the workflow.
Python remains a favorite in quantitative finance because of its mature ecosystem for analysis, APIs, data engineering, and machine learning. Pine Script, used on TradingView, is excellent for rapid prototyping, chart-based logic, alerts, and visual strategy development. It does not place trades directly, so live automation usually relies on alerts plus middleware. For Forex and CFD workflows, MQL4/MQL5 in MetaTrader remains common because it combines charting, strategy testing, and broker connectivity. If you are creating TradingView indicators or strategies and want to shorten the path from idea to code, LuxAlgo Quant is especially relevant because it is purpose-built for Pine Script generation, validation, debugging, and chart-to-code workflows.
Before risking real money, always start with paper trading. Environments such as Alpaca paper trading or MetaTrader demo accounts let you verify that your alerts, middleware, broker integration, and sizing logic work together under live market timing. For Python projects, use isolated environments such as venv or conda so dependencies stay reproducible. TradingView users can also pair this workflow with AI Backtesting to compare strategy variants and with Quant documentation when they need help generating or refining Pine Script.
Code, Test, and Deploy Your Strategy
Write and Debug the Code
When writing your code, focus on modular components. Break the system into separate engines for signal processing, position sizing, risk management, order execution, and monitoring. That structure makes the codebase easier to test, debug, and extend. If you are developing on TradingView, it also makes it easier to hand off discrete logic blocks to LuxAlgo Quant for generation or debugging instead of trying to rewrite an entire script at once.
Make sure to differentiate between warnings and errors. Warnings may justify degraded operation or operator review, while hard errors should stop execution before bad orders reach the market. Also log every signal, position adjustment, fill, and system event. Those records are invaluable when you need to explain why live behavior drifted from a backtest or why a broker API responded in an unexpected way. For Pine Script workflows, Quant can also help surface code issues early by validating and refining indicator or strategy logic before you deploy it to TradingView.
"If it cannot be coded, it is not a rule."
Once your code has been thoroughly debugged and validated, you are ready to test it in a simulated live environment.
Move from Paper Trading to Live Trading
After debugging, the next step is paper trading. This phase is essential for verifying your strategy in real time without risking actual capital.
"Paper trading is not optional. If a strategy cannot survive a realistic demo environment, it is not ready for capital."
A strong paper-trading setup ensures that your execution logic, data feeds, and order handling behave as expected under real-time conditions. This is where you discover latency problems, rejected orders, duplicate alerts, time-zone mistakes, and other issues that backtests usually hide.
Once your strategy proves itself in paper trading, transition to live execution gradually. Many traders begin with reduced size, compare live fills against modeled assumptions, and only scale after the system behaves consistently. Protect capital with explicit stop criteria before launch, such as pausing the strategy if live drawdown materially exceeds backtest expectations or if execution quality deteriorates.
"Most strategy ideas do not survive a full validation process, which is why gradual rollout matters."
Following these steps helps take a trading strategy from concept to a fully operational automated system capable of delivering more consistent and scalable execution.
Monitor, Optimize, and Refine in Live Markets
Track and Optimize Performance
Once your strategy goes live, monitor it continuously. Compare live results with your backtest assumptions to detect performance drift early. Differences can come from market regime changes, latency, slippage, fees, liquidity, or simple implementation mistakes that only appear under live conditions.
A sensible next step is moving from paper trading to a small live allocation. That gives you exposure to real fills, real fees, and broker-specific behavior while keeping risk contained. To protect capital, use an automated kill switch that can disable new orders if abnormal losses, broken data feeds, or execution errors appear. Risk limits should be tailored to your own system rather than copied from a generic formula, but the principle is the same: define them before the strategy goes live.
While monitoring performance metrics, it is equally important to address technical issues before they compound into trading losses.
Handle Common Technical Challenges
Even with rigorous testing, technical issues will still arise, so prepare for them in advance. Run edge-case tests for system restarts, network interruptions, exchange halts, and spikes in volatility. Maintain a runbook for broker API outages, authentication failures, and recovery procedures. Use version control tools like Git to tag the exact code revision used in each validated backtest so you always know what was deployed.
Conclusion
Turning a trading concept into an automated strategy requires careful planning and attention to detail. The process includes defining rules, validating the idea with data, backtesting with historical data, designing the system architecture, coding and debugging, and then monitoring performance in live markets. Each step builds on the previous one, creating a structured process that reduces emotional decision-making and supports disciplined refinement.
Automation offers a level of consistency that discretionary execution often cannot match. A well-built strategy executes exactly as designed and can monitor markets continuously. That said, markets are dynamic, so strategies still need review as volatility, liquidity, and correlations change over time.
For long-term success, continuous oversight is essential. Regularly compare live trading results with backtest data, maintain a stable codebase with version control, and document your assumptions so operational issues can be diagnosed quickly. If you build on TradingView, combining LuxAlgo Quant for Pine Script development with AI Backtesting for validation can shorten the path from idea to tested execution logic.
While building an automated strategy can be complex, following a structured process makes it far more manageable. Take your time, test rigorously, and treat every result as a learning opportunity. By sticking to these steps, you keep your trading automation journey aligned with disciplined research, controlled deployment, and continuous improvement.
FAQs
How do I avoid overfitting when backtesting?
To avoid overfitting during backtesting, focus on strategies that still make sense on new, unseen data. Keep the logic as simple as possible, avoid optimizing too many parameters, and always validate results with out-of-sample testing. Walk-forward analysis and Monte Carlo analysis are useful because they show whether the edge survives different sequences and market conditions. It also helps to pair backtests with forward testing in demo or small live environments so you can confirm that the strategy holds up outside the research environment.
What trading costs should I include in my backtests?
When running backtests, include the full set of trading costs that would affect real execution: commissions, exchange or routing fees where applicable, spreads, slippage, financing costs for leveraged products, and any borrow or overnight holding costs that apply to the instrument. Ignoring these inputs can make a weak strategy look profitable on paper.
Once those costs are modeled realistically, your backtest becomes much closer to live conditions. That makes it easier to judge whether the strategy has enough edge to survive after friction is applied.
When is my bot ready for live trading?
Your bot is ready for live trading only after it has passed several checks: a backtest with realistic assumptions, forward testing in paper mode, and a small live rollout that confirms fills, slippage, alerts, and broker behavior match expectations. You should also have position sizing rules, risk limits, logging, and an emergency shutdown process in place.
Once those pieces are working consistently, you can scale gradually instead of switching from demo to full-size trading in one step.
References
LuxAlgo Resources
- LuxAlgo Quant
- Quant Documentation
- AI Backtesting Assistant
- AI Backtesting Documentation
- Stress Testing for Trading Strategies