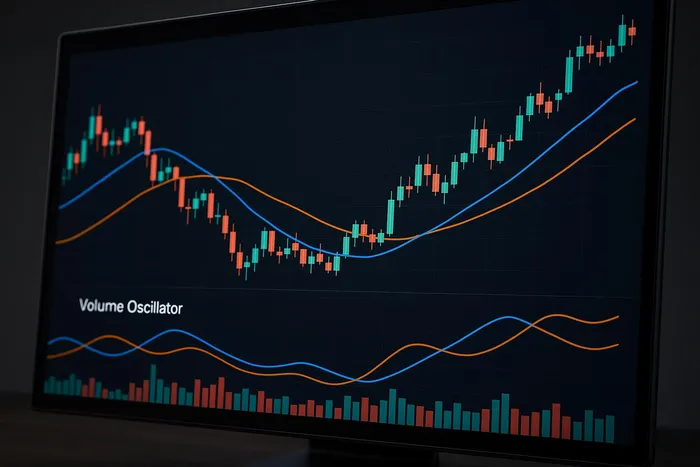

Explore the Volume Oscillator and its role in assessing trading volume momentum, complemented by comparisons to OBV and A/D Line indicators.
The Volume Oscillator (VO) is a technical analysis tool that measures the difference between two moving averages of a security's trading volume: one shorter-term (fast) and one longer-term (slow). It highlights shifts in volume momentum, helping traders assess the strength or weakness of price trends. A VO above zero suggests rising momentum, while a VO below zero indicates weakening momentum.
Key Points:
- How It Works: Subtract the slow moving average from the fast moving average, divide by the slow moving average, and multiply by 100.
- Common Settings: Fast average (e.g., 14 periods), slow average (e.g., 28 periods).
- Signals: Above zero = strong momentum; below zero = weakening trend.
- Use Cases: Confirms trends, identifies divergences, and evaluates volume strength during price moves.
Compared to On-Balance Volume (OBV) and the Accumulation/Distribution Line (A/D Line), the VO is more focused on short-term volume momentum, making it ideal for traders looking to spot early trend shifts. OBV tracks cumulative volume flow, while the A/D Line combines volume with price positioning. Each tool has strengths and limitations, but combining them can provide a fuller market view.
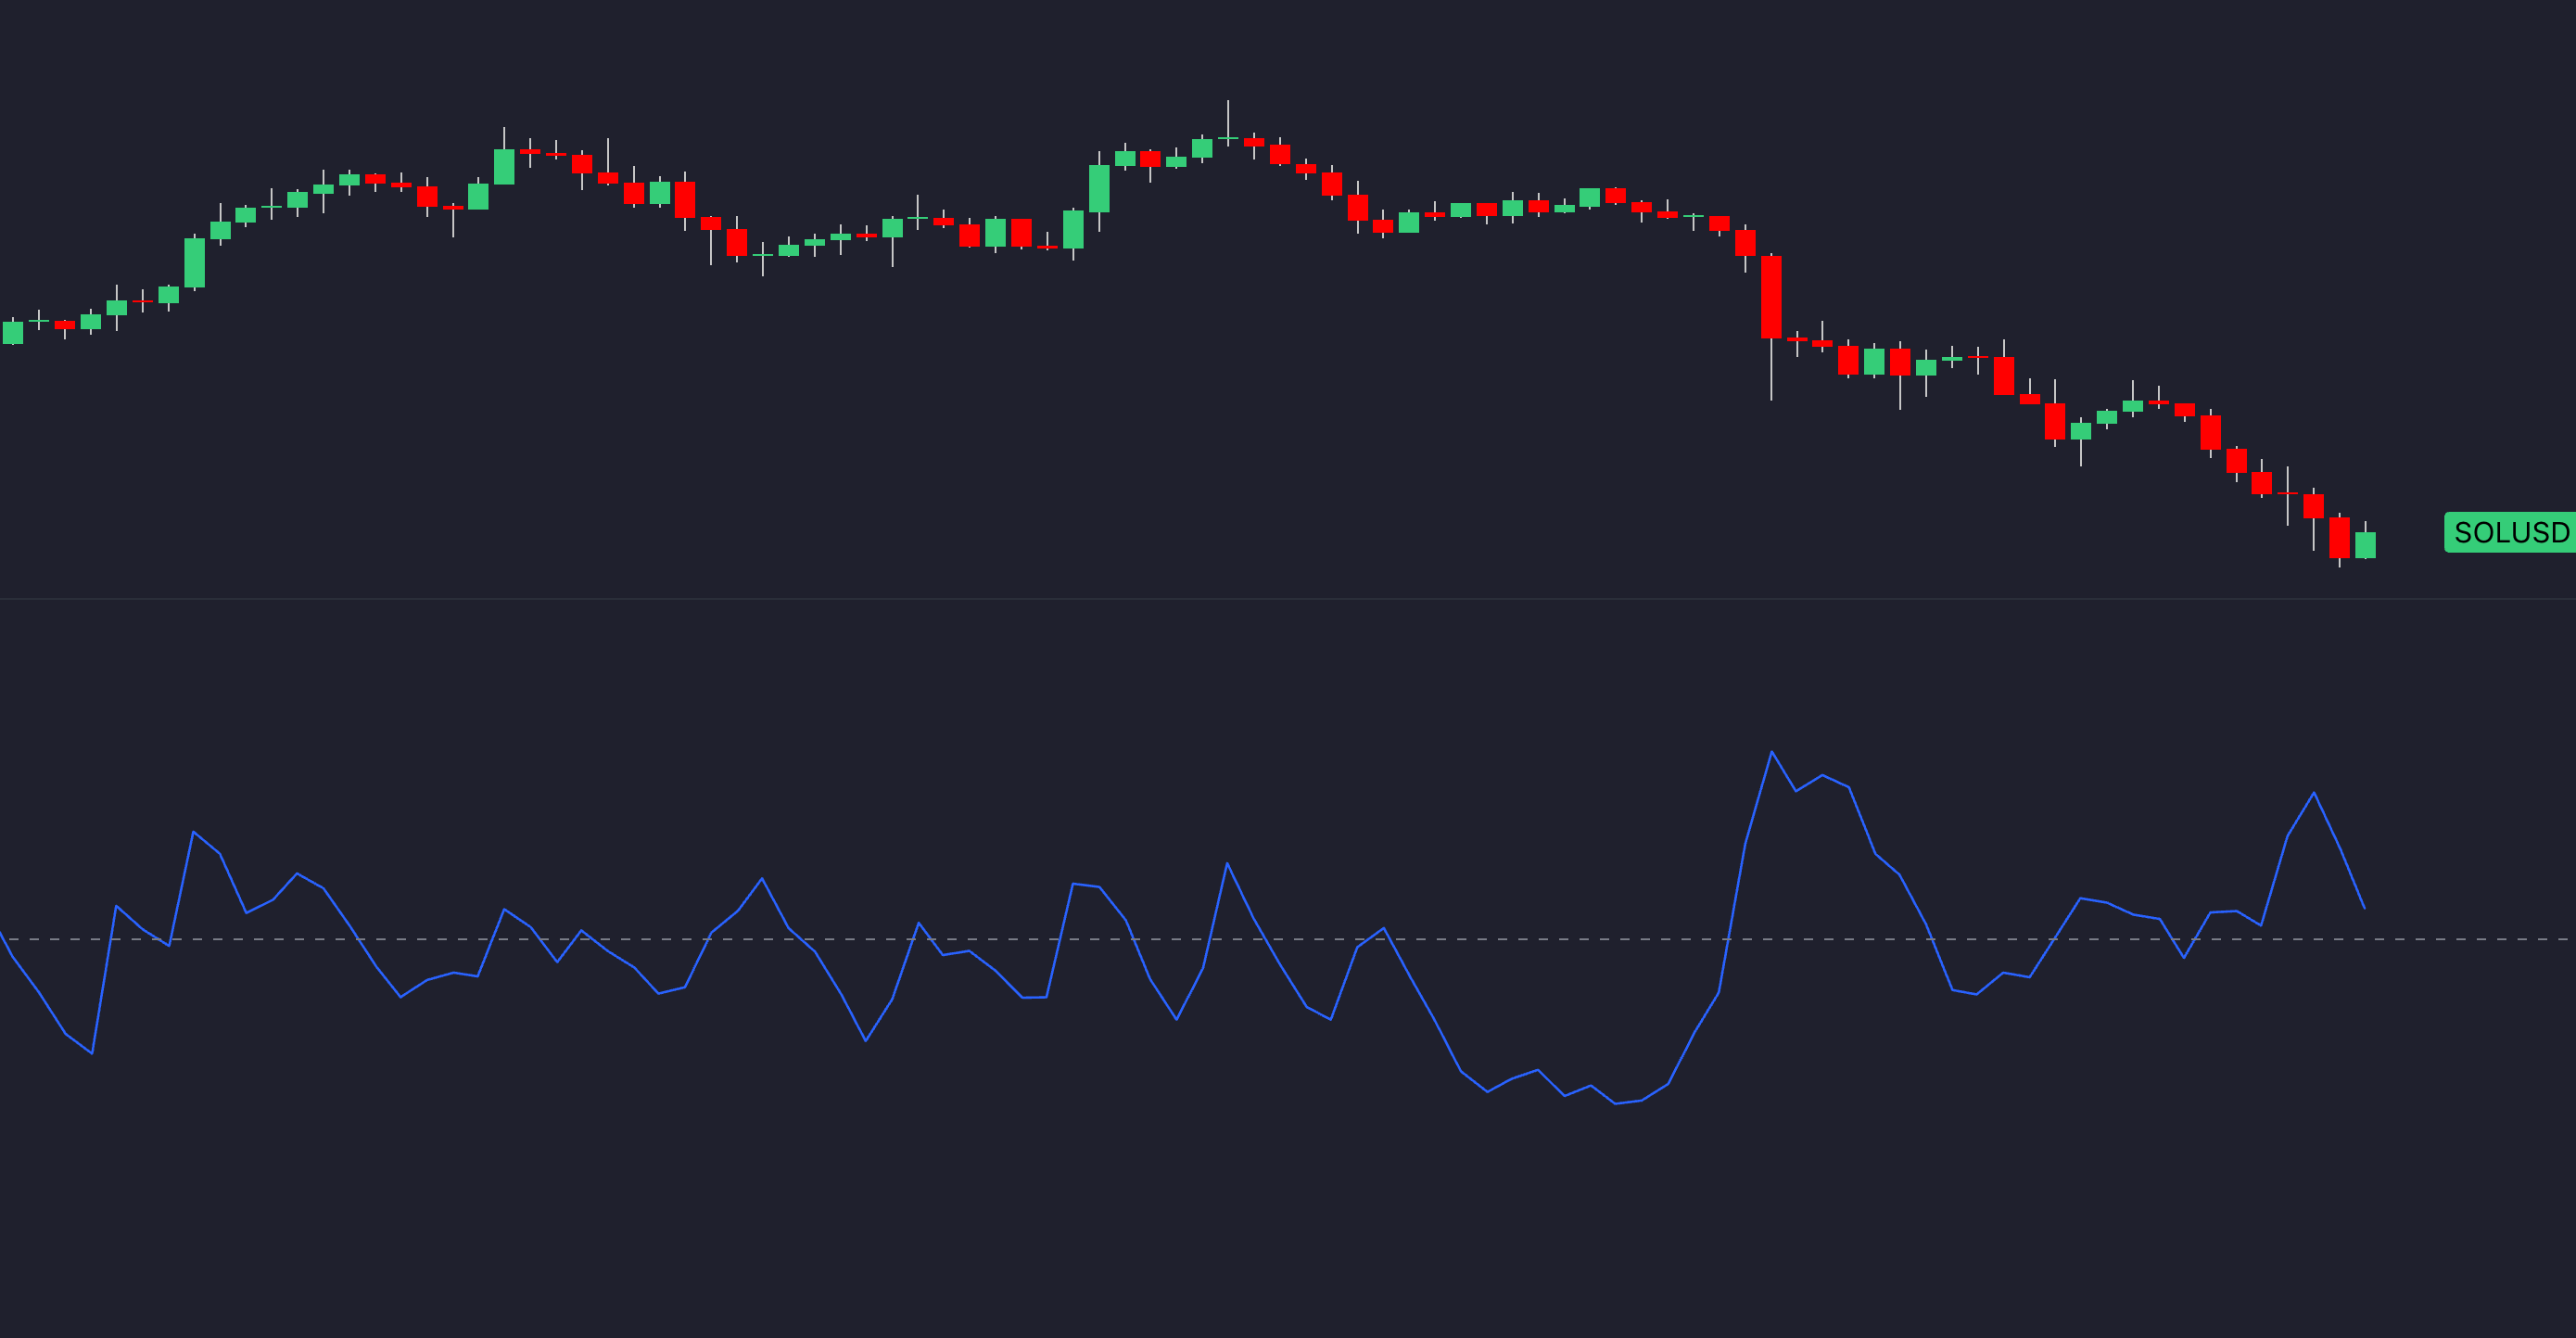
1. Volume Oscillator (VO)
Calculation Method
The Volume Oscillator takes a straightforward approach, focusing on percentage differences rather than raw volume numbers. It measures the gap between two moving averages of a security's volume: one that reacts quickly (fast moving average) and another that moves more slowly (slow moving average). Using an SMA will make the VO slightly smoother, while an EMA responds faster to recent changes.
"The Volume Oscillator displays the difference between two moving averages of a security's volume expressed as a percentage." [1]
To calculate it, subtract the slow moving average from the fast moving average, divide the result by the slow moving average, and multiply by 100. Both Simple and Exponential MAs are commonly used with typical settings such as a 14-period fast and 28-period slow average.
| Moving Average Component | Typical Periods | Purpose |
|---|---|---|
| Shorter Period (Fast) | 5, 12, or 14 periods | Tracks short-term volume changes and momentum shifts |
| Longer Period (Slow) | 20, 26, or 28 periods | Provides a broader view of volume trends for comparison |
Once calculated, the oscillator's position relative to zero becomes a key indicator for interpreting market activity.
Signal Generation
The Volume Oscillator generates actionable signals based on its movement around the zero line:
- Above Zero: Indicates that recent volume is outpacing the longer-term average, hinting at stronger momentum.
- Below Zero: Suggests that short-term volume is lagging, which could point to waning interest or momentum.
Traders often watch for crossovers of the zero line as potential entry or exit signals. For instance, a move above zero may confirm growing momentum, while a drop below zero might indicate weakening trends.
Market Responsiveness
How quickly the Volume Oscillator reacts depends on the period settings for its moving averages. Shorter periods respond faster to sudden volume changes, making them ideal for day traders and swing traders. On the other hand, longer periods filter out smaller fluctuations, helping to spotlight major volume trends. For a quick primer on why volume matters to trend strength, see this overview from the CME Group.
"The Volume Oscillator is a vital tool in technical analysis, using two moving averages of trading volume to generate signals about the strength and weaknesses of trends." [2]
This adaptability makes the indicator useful for fine-tuning entry and exit points across different trading scenarios.
Use Cases
The Volume Oscillator is particularly helpful for confirming price trends and spotting divergences between volume and price movement. For example:
- Divergences: If price reaches new highs but the oscillator doesn’t confirm, it might indicate a weakening trend.
- Rising Oscillator During Declines: This could signal growing volume during a downtrend, hinting at potential market accumulation.
Traders also use it to time their trades more effectively. A rising oscillator during a price breakout suggests strong volume backing the move, increasing the likelihood of trend continuation. Conversely, a falling oscillator during a rally may signal weak buying interest, prompting traders to reassess their positions.
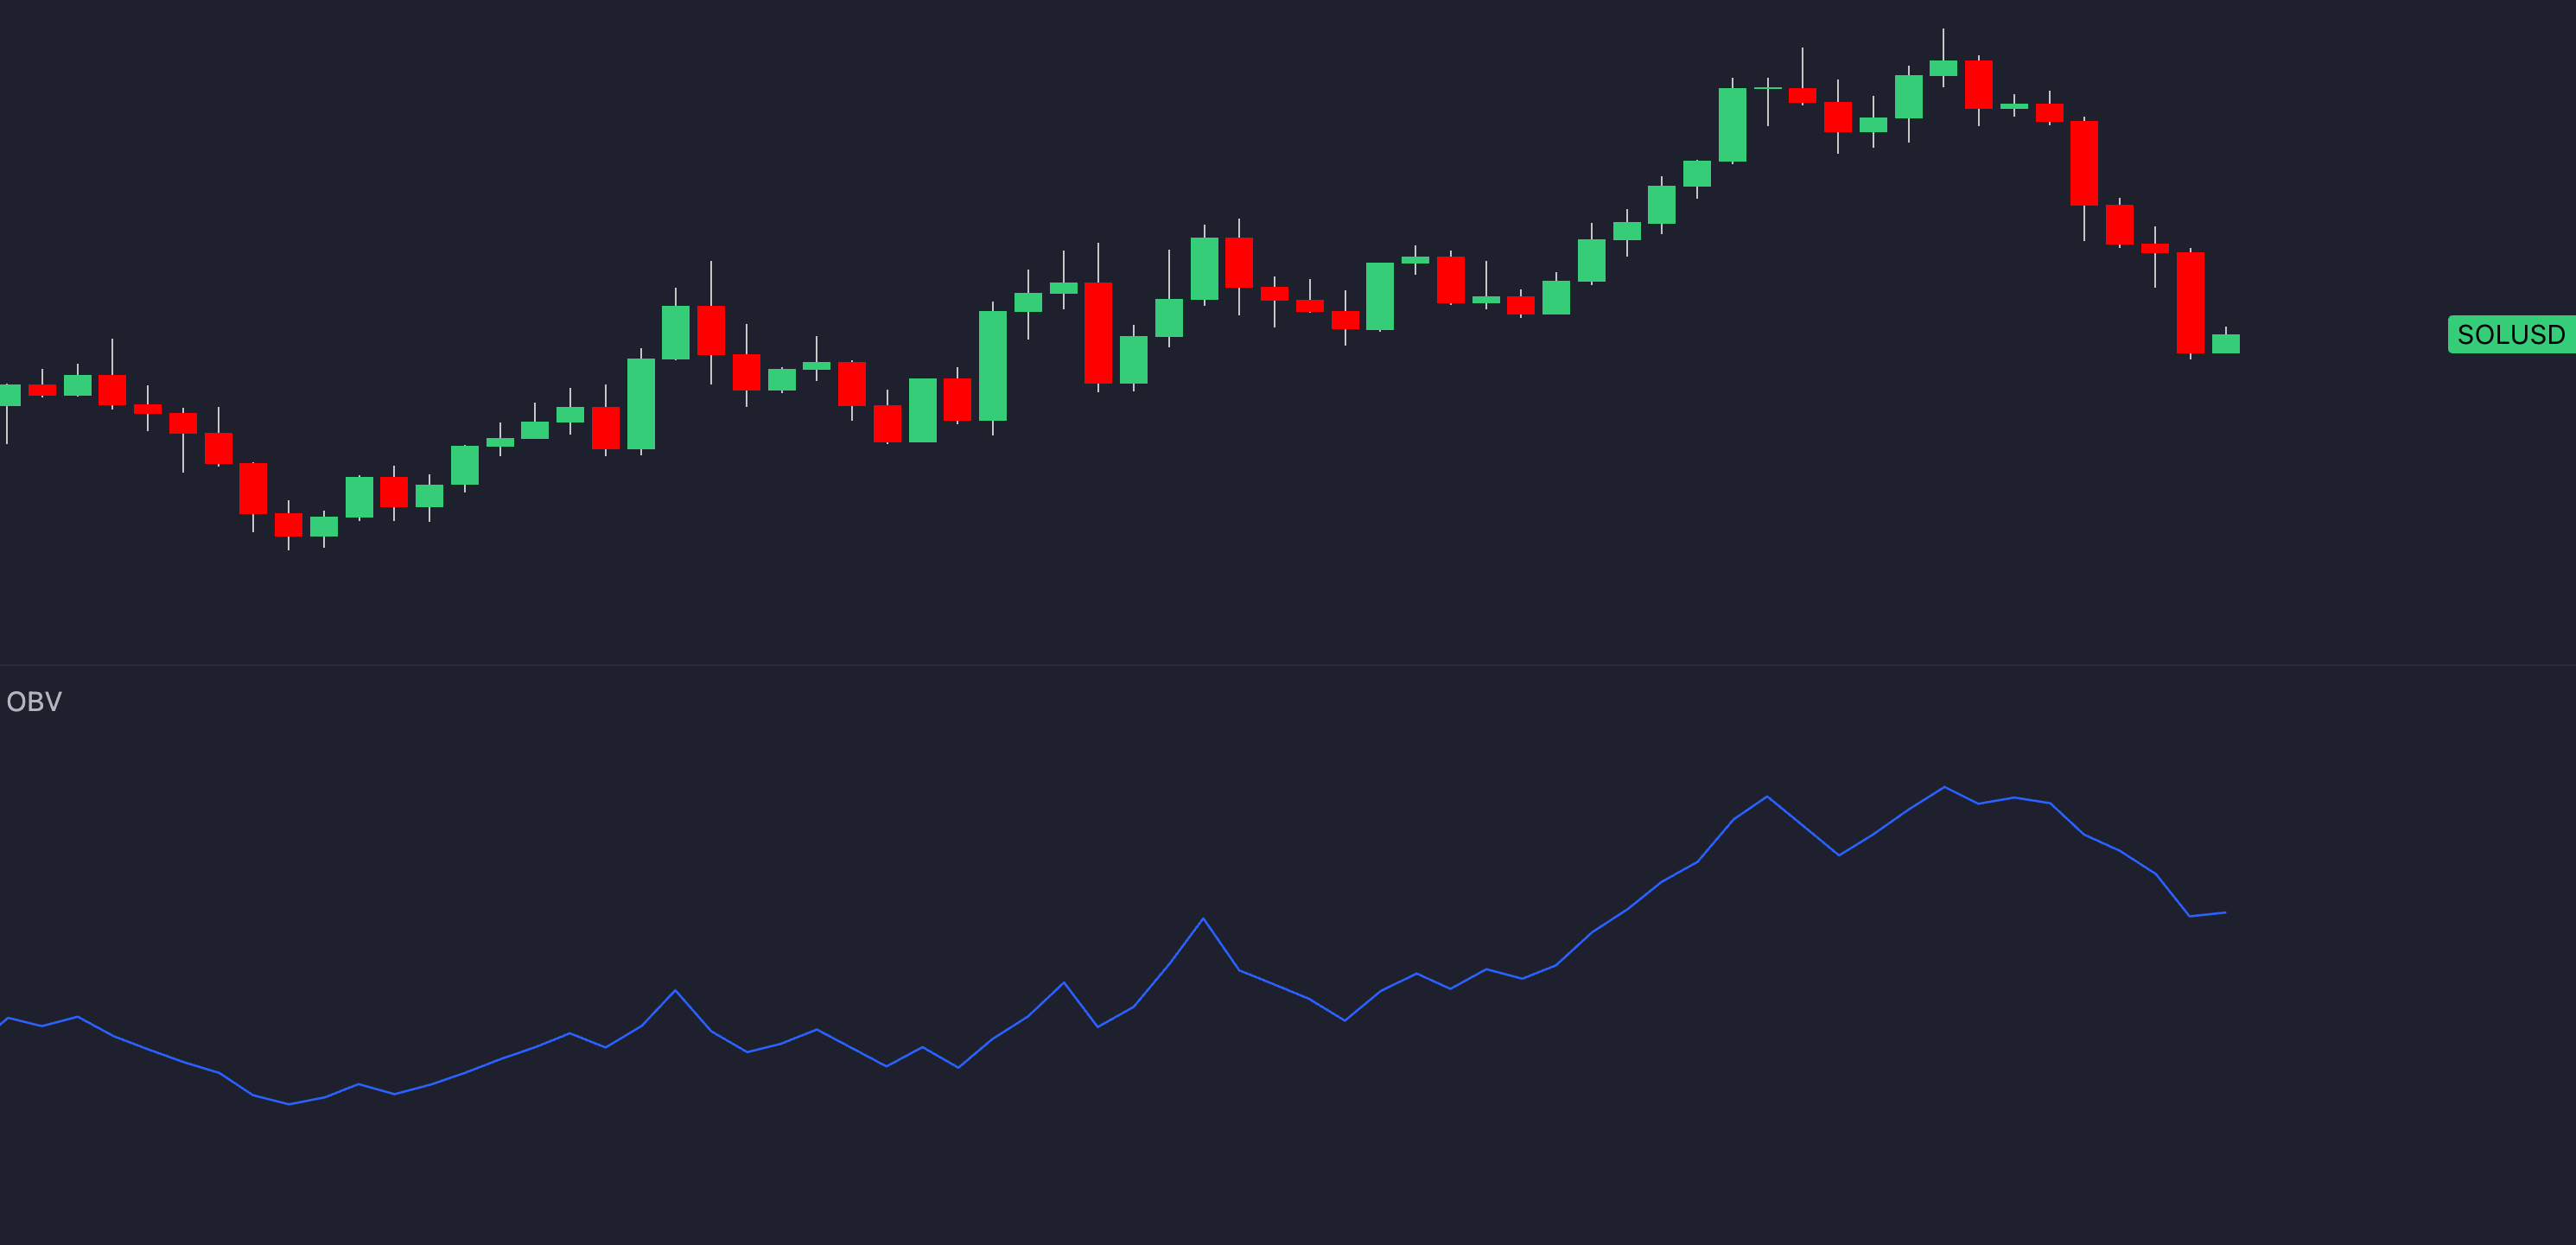
2. On-Balance Volume (OBV)
Calculation Method
On-Balance Volume (OBV) calculates a running total of trading volume by adding it when prices rise and subtracting it when prices fall. Starting with a base value, OBV adds the entire period's volume if the closing price is higher than the previous close, subtracts it if the price is lower, and keeps it unchanged if the price remains the same.
This approach generates OBV values that reflect the actual magnitude of volume changes over time. By capturing these shifts, OBV allows traders to analyze volume trends effectively and compare them across different periods.
Signal Generation
OBV stands apart from percentage-based indicators like the Volume Oscillator by focusing on cumulative volume flow to gauge trend strength. Instead of oscillating around a zero line, OBV signals are based on its direction and slope, helping traders identify accumulation (rising OBV) or distribution (falling OBV).
Divergences offer key insights. If a stock hits new highs but OBV fails to follow suit, this bearish divergence may indicate waning buying interest. On the flip side, when prices hit new lows but OBV stays strong, bullish divergence could signal hidden strength, often preceding upward price moves.
Market Responsiveness
OBV's ability to reflect volume changes immediately makes it a valuable tool for spotting shifts in market sentiment. It adapts to all timeframes, from short-term intraday charts to longer-term weekly or monthly views.
For short-term traders, OBV on 5-minute or hourly charts can reveal volume spikes during breakouts. Long-term investors use daily or weekly charts to confirm broader trends. During high-volume sessions—such as earnings announcements or major news events—OBV often shows sharp movements, highlighting significant institutional activity (see CME Group’s explanation of volume).
Use Cases
OBV is particularly useful for confirming price trends and spotting early reversals. It shines during sideways markets, where prices consolidate but volume patterns hint at the next move. For instance, rising OBV during consolidation suggests accumulation and a potential breakout to the upside, while falling OBV indicates distribution and a possible downward move.
Portfolio managers rely on OBV to fine-tune entry and exit points. When a stock shows strong price movement supported by rising OBV, it provides confidence for increasing position sizes or extending holding periods. Conversely, if price gains occur alongside declining OBV, it may signal a good time to reduce positions or take profits.
Additionally, OBV can help detect smart money activity. By tracking consistent large-volume trades in one direction, OBV reveals underlying trends even when daily price movements seem random or contradictory to the volume flow.
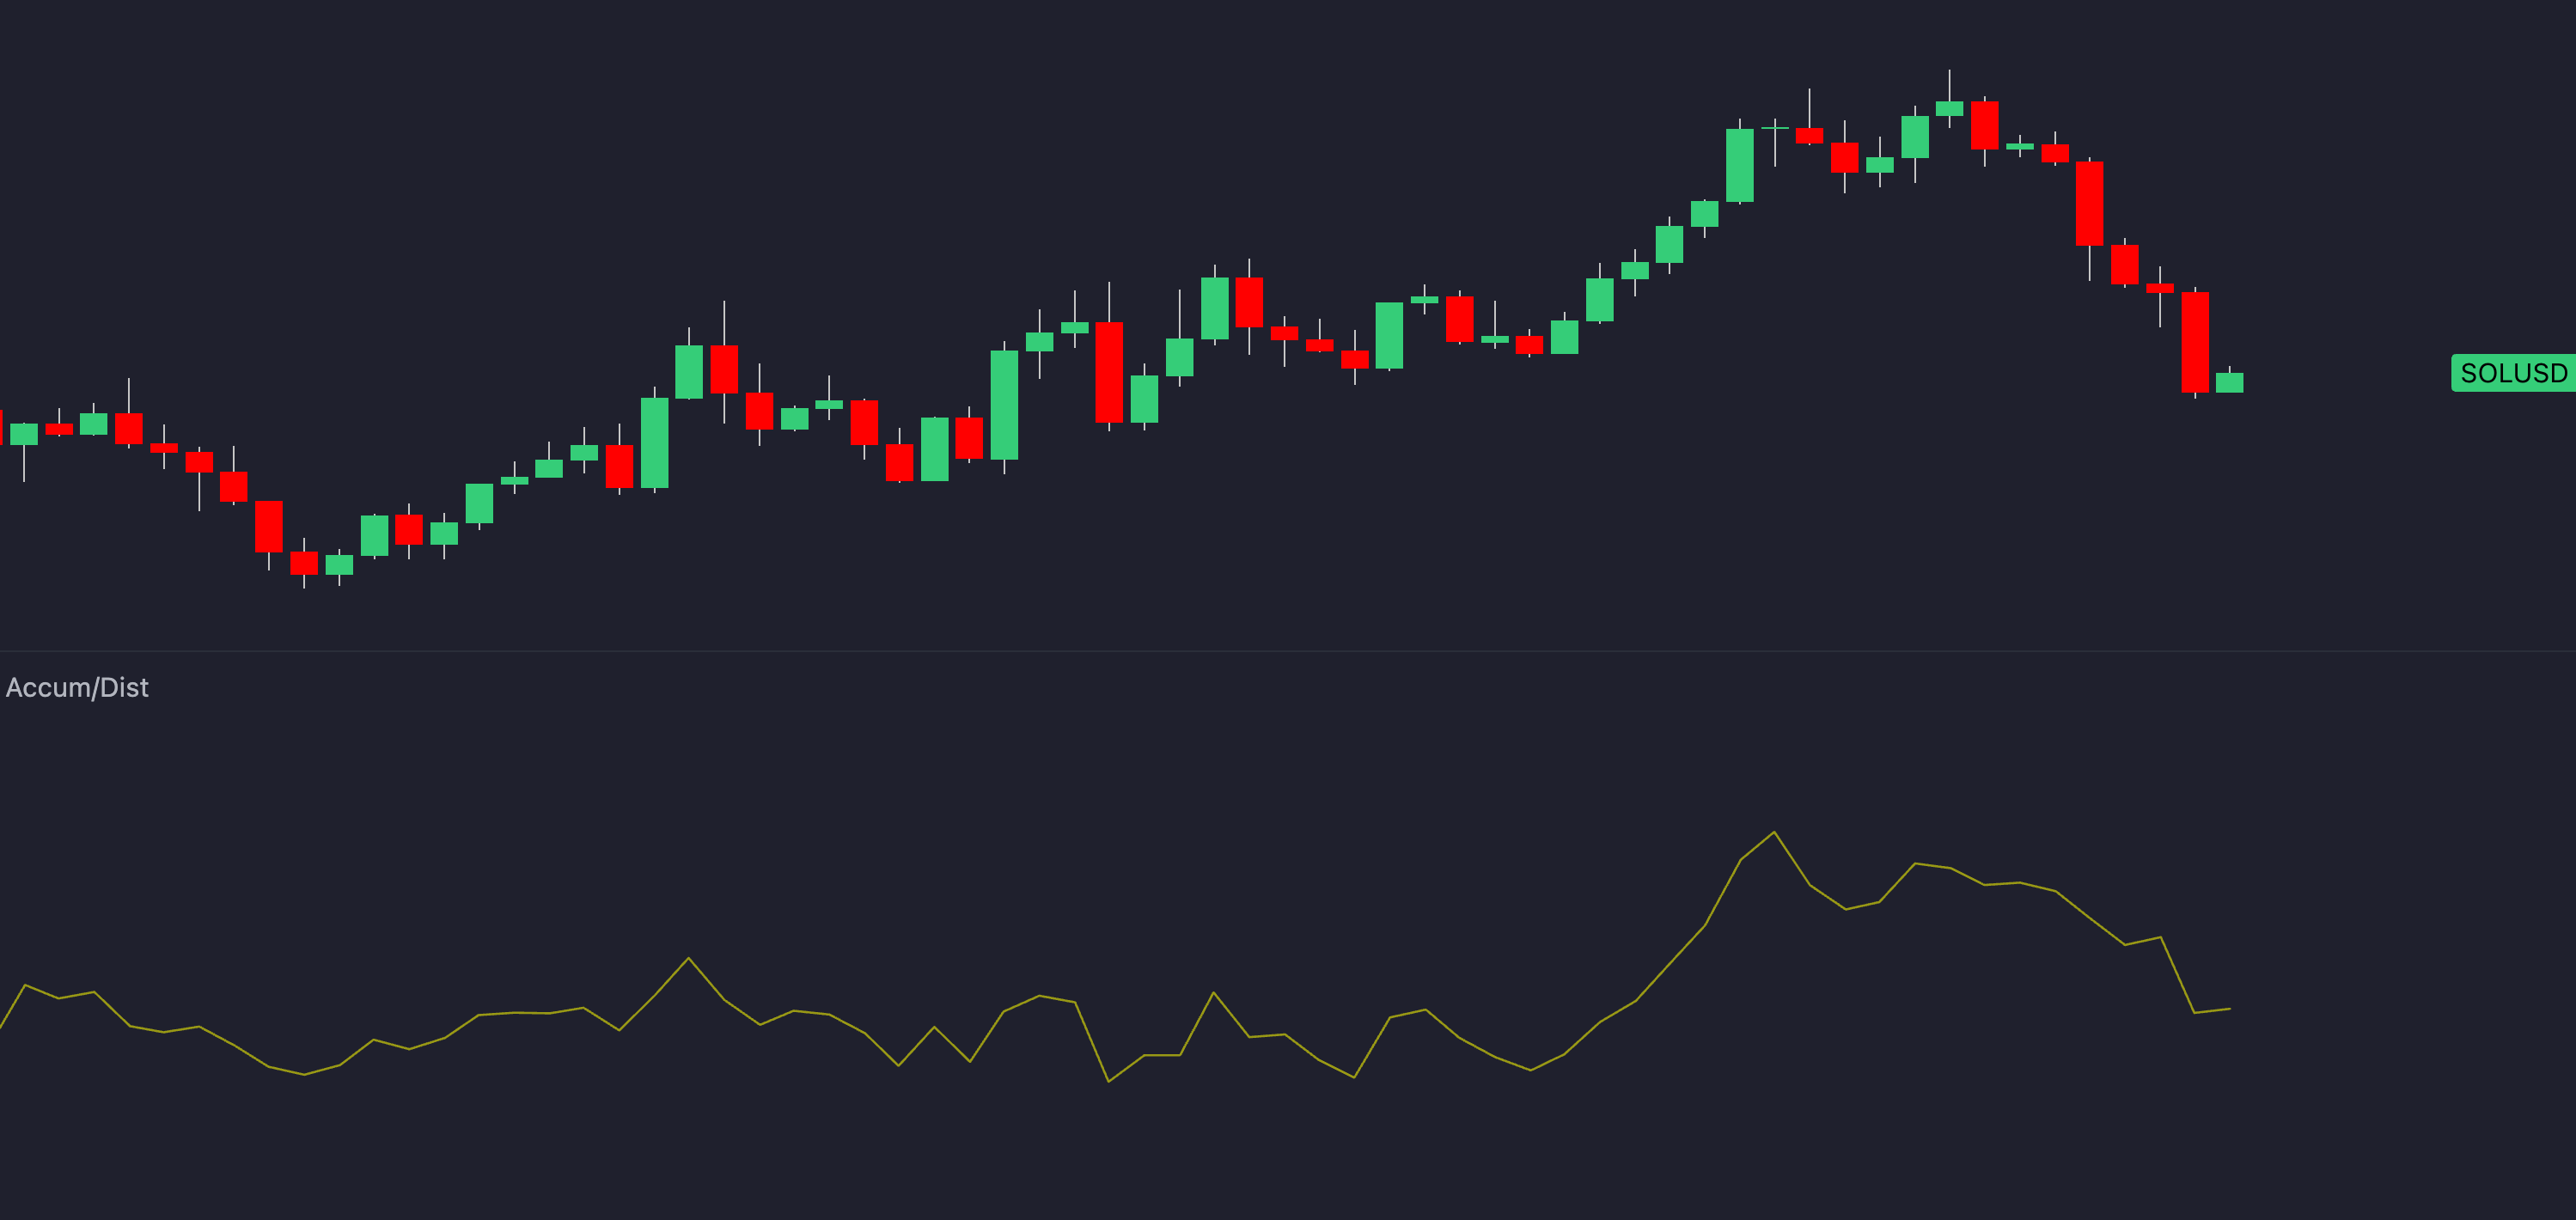
3. Accumulation/Distribution Line (A/D Line)
Calculation Method
The Accumulation/Distribution Line (A/D Line) builds on earlier volume-based tools by factoring in where the closing price sits within the trading range for a more nuanced view of money flow. Essentially, it combines price and volume into a cumulative figure that reflects buying and selling pressure. Unlike On-Balance Volume (OBV), which uses the total volume for each period, the A/D Line first calculates a Money Flow Multiplier and then applies it to the volume.
Here’s how the Money Flow Multiplier is determined:
((Close - Low) - (High - Close)) / (High - Low)
This formula generates a value between -1 and +1, depending on how close the closing price is to the day’s high or low. A multiplier close to +1 means the stock closed near its high, suggesting accumulation. On the flip side, a value near -1 indicates the stock closed near its low, signaling distribution.
To compute the A/D Line, this multiplier is multiplied by the volume for the period, and the result is added to the previous total. This method refines volume analysis by incorporating the price’s position within the trading range, offering a clearer picture of market behavior.
Signal Generation
The A/D Line is particularly useful for identifying price trends and divergences. A rising A/D Line suggests that buyers are dominant, driving prices higher with strong volume support. Conversely, a declining A/D Line indicates sellers are in control, pushing prices lower with significant volume.
Divergence analysis is a key feature of the A/D Line. For instance:
- If prices hit new highs but the A/D Line fails to do the same, this bearish divergence could signal weakening momentum.
- If prices drop to new lows but the A/D Line remains above its previous lows, this bullish divergence might reveal hidden strength in the stock.
Unlike VO or OBV, the A/D Line takes into account where prices close within the day’s range, offering a more detailed view of market sentiment. It’s also helpful for trend confirmation—during strong uptrends, the A/D Line typically moves in sync with prices, reinforcing the trend’s strength. If the A/D Line starts to falter while prices are still rising, it can serve as an early warning sign of a potential reversal.
Market Responsiveness
The A/D Line reacts quickly to shifts in both price and volume, making it a versatile indicator across various market conditions. Its ability to integrate intraday price positioning provides traders with sharper insights into the intensity of buying or selling pressure.
In trending markets, the A/D Line helps differentiate between legitimate breakouts and false alarms. For example:
- A breakout accompanied by a rising A/D Line often signals strong institutional involvement, suggesting the move has staying power.
- A breakout with a declining A/D Line, on the other hand, may lack the volume support needed to sustain the move and could fail quickly.
This indicator is especially effective during earnings seasons or major news events, when volume spikes can lead to significant money flow shifts. These moments often generate clear signals, helping traders position themselves for sustained price movements.
How to Use the Volume Oscillator Indicator Like a Pro!
Advantages and Disadvantages
Volume indicators come with their own set of strengths and weaknesses. Knowing these trade-offs can help traders pick the right tools based on trading style and market analysis needs. Below is a breakdown of the benefits and limitations of each indicator.
The Volume Oscillator is great for spotting short-term volume changes and momentum shifts. Its oscillating nature makes it easy to see when volume is above or below average, which can confirm breakouts or hint at potential reversals. However, its sensitivity can also lead to false signals, especially in choppy market conditions. Additionally, getting the settings for the two moving averages just right can be tricky, and using different timeframes might result in conflicting signals.
On-Balance Volume (OBV) stands out for its simplicity and ability to highlight trend direction. Its cumulative method smooths out daily volume fluctuations, making it ideal for analyzing long-term trends and spotting divergences. Plus, its straightforward calculation makes it accessible to traders of all levels. However, OBV has its drawbacks—it treats all volume equally, regardless of where prices close within the trading range. This can lead to misleading signals during price gaps or when intraday price action doesn’t match the closing direction.
The Accumulation/Distribution Line (A/D Line) offers a more detailed analysis by factoring in intraday price positioning. This allows it to detect subtle changes in money flow, making it especially useful during earnings announcements or news events when volume spikes. That said, its complexity can be a double-edged sword. The indicator can be overly sensitive, and stocks with wide trading ranges or unusual price patterns might distort its calculations.
| Indicator | Advantages | Disadvantages |
|---|---|---|
| Volume Oscillator (VO) | • Highlights momentum shifts • Identifies volume extremes • Useful for breakout confirmation • Customizable time settings |
• Generates false signals in volatile markets • Requires careful parameter tuning • Signals may conflict across timeframes • Struggles in low-volume conditions |
| On-Balance Volume (OBV) | • Easy to calculate and interpret • Clearly shows trend direction • Smooths volume data for clarity • Strong for divergence analysis • Reliable in trending markets |
• Ignores intraday price positioning • Misleading during price gaps • Less effective for short-term changes • Can lag in fast-moving markets |
| Accumulation/Distribution Line (A/D Line) | • Accounts for intraday price action • Detects detailed money flow shifts • Useful for spotting institutional activity • Excels during news-driven volume spikes • Strong divergence signals |
• Overly sensitive at times • Complex for beginners to understand • Impacted by wide trading ranges • May produce noise in volatile conditions |
These comparisons highlight how different market conditions and trading strategies can affect indicator performance. For example, day traders often lean on the Volume Oscillator because of its quick response to volume changes, while swing traders might prefer the A/D Line for its nuanced money flow insights. Position traders, on the other hand, frequently rely on OBV for its clear trend signals and reduced short-term noise.
In high-volatility markets, the A/D Line can offer valuable insights into institutional money flow, though it may also generate excessive signals. Conversely, during low-volatility periods, OBV's steady approach tends to be more dependable, while the Volume Oscillator might struggle due to insufficient volume.
The choice of indicator can also vary by sector. For example, technology stocks, which frequently experience price gaps, might make OBV less reliable. In contrast, utility stocks with steady trading patterns could work well with any of the three indicators. Financial stocks during earnings seasons often see the A/D Line shine, as its sensitivity captures the impact of significant volume spikes and intraday price changes.
No single indicator is perfect. Many traders combine multiple tools to balance out weaknesses and leverage unique strengths. Understanding how these indicators analyze volume and momentum lays the groundwork for a deeper evaluation in the conclusion. If you want to explore rule-based ideas quickly, you can also try AI Backtesting to discover strategies that incorporate volume-based conditions.
Conclusion
When comparing these three volume indicators, it’s clear that each has its own role in technical analysis. The Volume Oscillator stands out for its ability to pinpoint short-term momentum shifts and highlight volume extremes. While On-Balance Volume (OBV) focuses on long-term trends and the Accumulation/Distribution (A/D) Line tracks money flow, the Volume Oscillator provides immediate feedback on volume momentum.
One of the key advantages of the Volume Oscillator is its flexibility. By adjusting the moving averages, traders can tailor it to specific timeframes and market conditions, making it particularly effective for confirming breakouts.
The choice of indicator ultimately depends on your trading approach. For day traders who need quick decision-making tools, the Volume Oscillator’s sensitivity to volume changes can be invaluable. Swing traders might find it useful to pair the Volume Oscillator with the A/D Line to gain insights into both momentum and money flow. On the other hand, position traders often lean toward OBV for its steady, trend-following nature. This reinforces the importance of aligning your indicator selection with your trading strategy and the current market environment.
Market conditions also play a significant role. For instance, the Volume Oscillator is particularly useful for identifying unusual volume spikes that could signal major price moves. In more stable, trending markets, OBV’s cumulative approach often delivers clearer, less noisy signals.
It’s important to remember that no single indicator can provide a complete picture. The Volume Oscillator works best when used alongside price action analysis and other technical tools. Its ability to capture shifts in volume momentum makes it a valuable addition to a trader’s toolkit, especially for confirming signals and avoiding false breakouts.
FAQs
How can the Volume Oscillator be combined with indicators like OBV and the A/D Line for better market insights?
The Volume Oscillator, combined with tools like On-Balance Volume (OBV) and the Accumulation/Distribution (A/D) Line, provides a more comprehensive look at market dynamics. OBV focuses on cumulative volume to highlight buying or selling pressure, while the A/D Line assesses whether a stock is being accumulated or sold off by analyzing the relationship between price and volume.
When used together, these indicators help traders confirm trends, identify divergences, and anticipate possible reversals with greater accuracy. The Volume Oscillator, which measures the difference between two volume moving averages, complements these tools by adding another layer of insight, making it easier to spot significant market changes and refine trading strategies.
What are the limitations of using the Volume Oscillator alone for trading, and how can traders address them?
The Volume Oscillator is a helpful tool for identifying volume trends, but it does come with certain drawbacks. For instance, it may produce false signals during times of low trading activity, when the market is moving sideways, or even in strong trends. This happens because the oscillator has a lagging nature and is highly sensitive to changing market conditions.
To overcome these challenges, traders often pair the Volume Oscillator with other tools such as price action analysis, trendlines, or the Relative Strength Index (RSI). It's also important to factor in the broader market environment to confirm signals and avoid acting on misleading information. This combination can lead to a more well-rounded and dependable trading approach.
What market conditions are ideal for using the Volume Oscillator, and how can traders customize its settings for better results?
The Volume Oscillator is particularly effective in trending markets, as it analyzes volume changes to confirm the strength and direction of price movements. When the oscillator rises, it often points to growing momentum. On the other hand, divergences or reversals in the oscillator can hint at possible market shifts.
Traders can fine-tune the oscillator's settings to align with their trading approach and the market environment. For shorter timeframes or highly volatile markets, a faster short-term moving average might be better for spotting quick shifts. In contrast, longer-term settings may work well for steady trends or less frequent trading activity.
References
LuxAlgo Resources
- Understanding Moving Averages and How Traders Use Them
- Volume Forecasting — Trading Indicator
- Signal Moving Average — Trading Indicator
- SMT Divergences — Trading Indicator
- Breakout Detector (Previous MTF High Low Levels)
- Market Sentiment Technicals — Trading Indicator
- Volumetric Toolkit — Trading Indicator
- Money Flow Profile — Trading Indicator
- Trending Market Toolkit — Trading Indicator
- Support & Resistance Dynamic — Trading Indicator
- Breakouts with Tests & Retests — Trading Indicator
- Price Action Concepts™ — Trading Indicator
- AI Backtesting Assistant — Fetching Strategies
- AI Backtesting Assistant — Introduction
- AI Backtesting Assistant (Main Page)
External Resources
- Fidelity — Volume Oscillator Guide
- Investopedia — Confirming Price Movements With Volume Oscillators
- TradingView — Understanding Volume Oscillator and Its Role
- Wikipedia — On-Balance Volume (OBV)
- Capital.com — Accumulation/Distribution Line
- CME Group — What Is Volume?
- Investopedia — Relative Strength Index (RSI)


