Expectancy
 By LuxAlgoAug 9, 2026
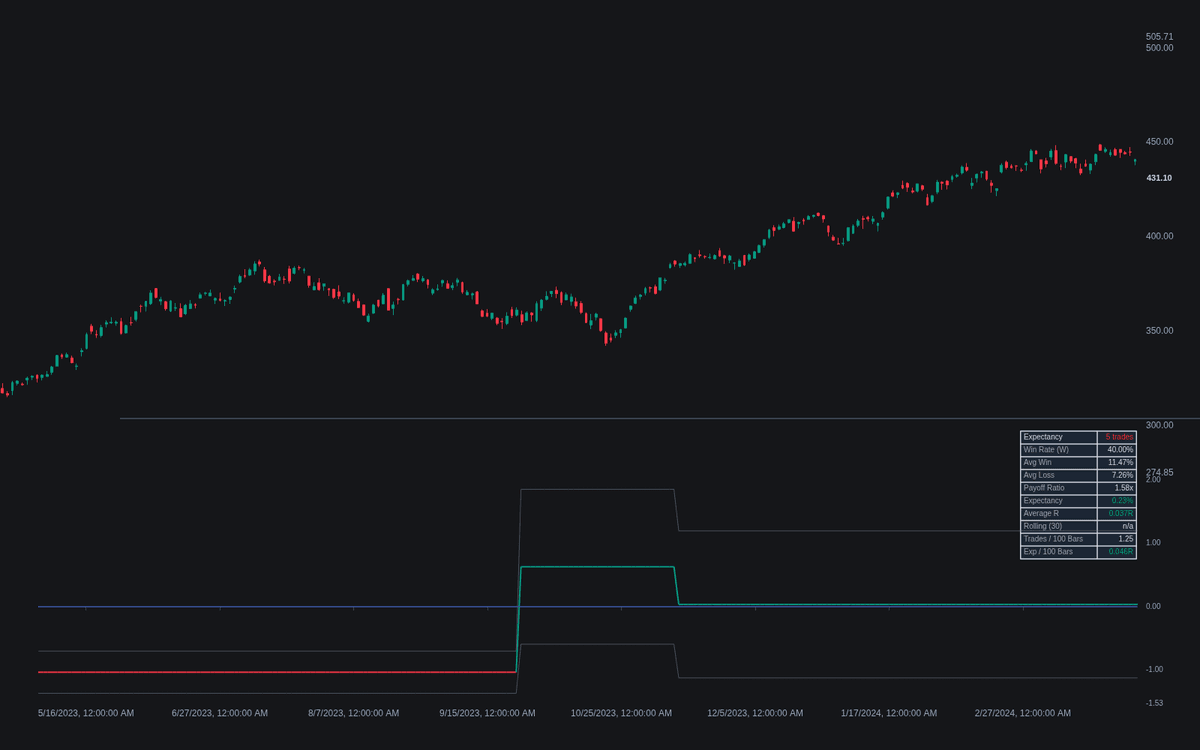
Expectancy puts the number a trading process is ultimately judged by on a live chart — the concept's first dedicated build in the library. A reference moving-average crossover system generates a closed-trade list, books each outcome net of costs, and plots expectancy as a sign-colored line around zero. A rolling estimate over recent trades tracks the live edge, a confidence band frames how far that estimate can wander by chance, and a dashboard itemizes the full decomposition down to trade frequency.
How to Trade the Expectancy?
- Sign of the line: positive means the process earns per trade before sizing; negative means there is nothing to size — both flips are alerted once the window fills.
- Edge decay: the rolling estimate sinking below the lower confidence band tints the pane and fires an alert — an early sign recent trades no longer resemble the full sample.
- Exp / 100 Bars: the dashboard multiplies expectancy by trade frequency — a small edge taken often can out-earn a large one taken rarely.
Expectancy Settings
- MA Type (default EMA), Fast Length (default 20), Slow Length (default 50), Source (default close) and Trade Direction (default Long & Short): the reference system generating the trade list.
- Outcome Basis (default Percent Of Entry): percent keeps outcomes comparable across long histories.
- Round-Trip Cost (default 0): commission plus slippage subtracted from every outcome.
- Initial Risk ATR (default 14) and Multiple (default 2): the ATR-based initial risk turning outcomes into R multiples.
- Rolling Window (Trades) (default 30) and Confidence Z-Score (default 1.96): the live estimate and its band width.
- Display Unit (default R Multiples (Average R)); toggles — Show Dashboard, Show Confidence Band, Highlight Edge Decay (on), Trade Markers On Price Chart (off).
Frequently Asked Questions
How does expectancy differ from the profit factor?
Profit Factor divides gross wins by gross losses into a dimensionless quality ratio; expectancy states the average result of one trade in concrete units. Same trade list, different summary — the dashboard's win rate and payoff rows connect the two.
Why does the build simulate its own trades?
Expectancy is a property of a trade list, not of price, so the pane needs a rule set to account for. The crossover system is a deliberately transparent reference — vary its inputs freely, the accounting is the point.
When is the reading trustworthy?
The dashboard shades the trade count toward its positive color as the sample approaches a few hundred trades; below that, prefer the band's message to the point value.

The Library is free. Quant makes it yours.
Pull any concept or indicator into Quant: rebuild it, retune it, or turn it into a backtested strategy of your own.