Profit Factor
 By LuxAlgoAug 9, 2026
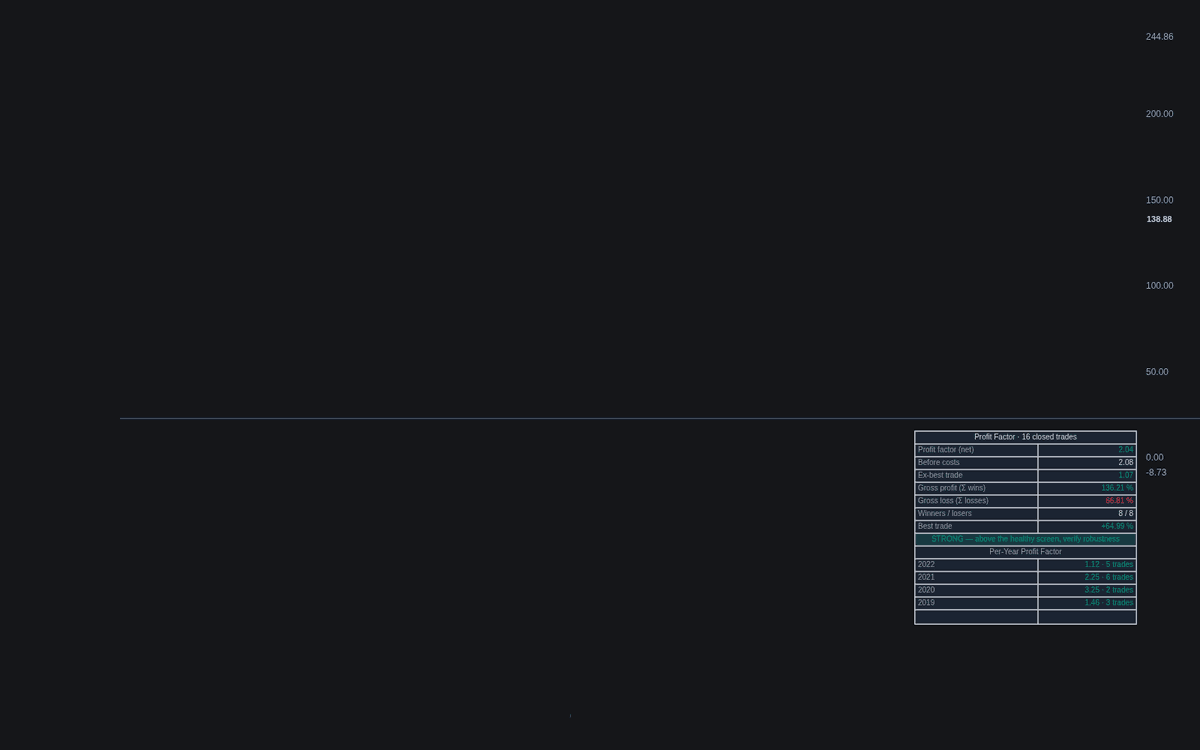
Profit Factor turns the most quoted line of a backtest report into something that can be watched decaying — the first live-chart plot of profit factor in the library. A built-in demo generator closes trades on the chart symbol under a selectable entry rule, every round trip is charged costs on both fills, and the ratio of summed winners to summed losers plots against a breakeven line, a shaded healthy zone and a suspicion level. The math itself is rule-agnostic.
How to Trade the Profit Factor?
- Above 1 and holding: gross profits exceed gross losses net of costs; breakeven crosses in either direction are alerted.
- Inside the Healthy Zone: 1.5 to 2.0 net of costs on a serious sample is the commonly quoted screen — the dashboard verdict tracks it.
- Above the Suspicion Level: readings past 3 usually mean a tiny sample or overfitting rather than edge; the no-loss infinity case is flagged the same way.
- Rolling Profit Factor below 1: the most recent trades stopped paying — the edge-decay alert to watch first.
Profit Factor Settings
- Entry Rule (default Moving Average Cross): also RSI 50 Cross and Donchian Breakout.
- Average Type (default EMA) with Fast Length (default 20) and Slow (default 50).
- RSI Length (default 14) and Breakout Length (default 20): the other rules' lookbacks.
- Trade Direction (default Long & Short): Long Only exits to flat instead of reversing.
- Cost per Side (%) (default 0.05): charged twice per round trip.
- Minimum Closed Trades (default 10): below it the ratio is withheld.
- Rolling Window (Trades) (default 20): trades in the rolling ratio.
- Healthy Zone (default 1.5 to 2) and Suspicion Level (default 3): the reference levels.
- Plot Ceiling (default 10): caps the plotted lines only.
- Show Dashboard (on) with Per-Year Breakdown (on); Show Rolling Profit Factor (on).
Frequently Asked Questions
Profit factor or expectancy?
Expectancy reports the mean outcome per trade and feeds sizing math directly; profit factor compresses the whole ledger into one robustness ratio that says nothing about trade frequency. Most traders read both.
What do the before-cost and ex-best-trade rows mean?
Before costs shows how much of the ratio survives friction — gross-of-cost readings materially overstate quality — while Ex-best trade recomputes the ratio without the largest winner, exposing systems whose edge is one lucky outlier.
Why is the dashboard showing an infinity symbol?
No losing trades yet. With gross losses at zero the ratio is undefined, so the build flags the case in warning color: a loss-free record is almost always a tiny sample, not an edge.

The Library is free. Quant makes it yours.
Pull any concept or indicator into Quant: rebuild it, retune it, or turn it into a backtested strategy of your own.