Extended Risk-adjusted Ratios
 By LuxAlgoApr 2, 2026
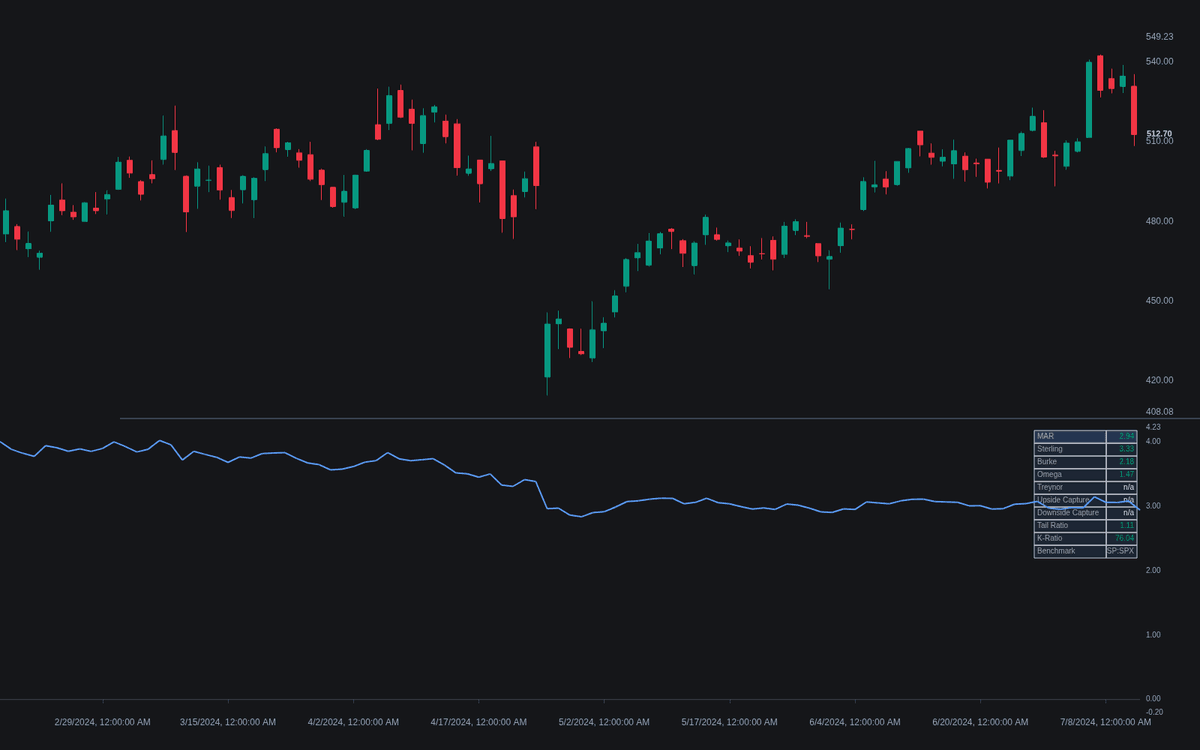
Extended Risk-adjusted Ratios treats the chart's source as an equity curve and scores it nine ways at once — the first working build of the extended risk-adjusted ratios catalog. MAR, Sterling and Burke divide growth by drawdown pain; Omega and the tail ratio interrogate the return distribution; Treynor and the capture pair read performance against a benchmark; the K-ratio grades equity-curve consistency. One ratio plots against its natural baseline — 0, 1 or 100% — while the dashboard keeps all nine visible.
How to Trade the Extended Risk-adjusted Ratios?
- Favorable side: dashboard values are color-graded against each ratio's own reference — Omega and the tail ratio above 1, capture ratios against 100%, the rest above 0.
- Plotted ratio: the selected series carries a gradient fill against its baseline, and a configurable level fires the pair of level alerts.
- Cross the families: strong MAR beside a weak K-ratio means growth came in ragged bursts — disagreement is the information.
Extended Risk-adjusted Ratios Settings
- Source (default close): the series treated as the track record (up to the most recent 5000 bars).
- Custom Start Date (off) with Start Date, and Warm-Up Bars (default 20): anchor the record and gate early readings.
- Benchmark (default SP:SPX): feeds Treynor's beta and the captures.
- Risk-Free Rate (%) (default 0): subtracted in the Burke and Treynor numerators.
- Omega Threshold (%) (default 0), Tail Ratio Upper Percentile (default 95), Tail Ratio Lower Percentile (default 5) and Sterling Cushion (%) (default 10): each ratio's convention dials.
- Plotted Ratio (default MAR) and Plotted Ratio Alert Level (default 0); Show Dashboard (on) with Position (Top Right) and Text Size (Small); Gradient Fill and Color-Code Dashboard Values (on).
Frequently Asked Questions
Why use these instead of the Sharpe ratio?
The Sharpe Ratio charges for volatility in both directions — often not the risk a trader fears. Each ratio here penalizes something specific: one deepest drawdown, average annual drawdowns, threshold shortfalls, benchmark beta or equity-curve raggedness.
Why do my values differ from published figures?
Conventions: tail percentiles, whether Sterling carries its 10% cushion (0 reproduces the modern variant), annualization and benchmark vary across sources. Match the inputs before comparing numbers.
What do the capture ratios mean?
Upside capture compares the record's average return in benchmark up-bars with the benchmark's own; downside repeats it for down-bars. Above 100% up with below 100% down is the favorable pairing.

The Library is free. Quant makes it yours.
Pull any concept or indicator into Quant: rebuild it, retune it, or turn it into a backtested strategy of your own.