Concept
Extended Risk-adjusted Ratios
Extended Risk-adjusted Ratios, also known as MAR, Sterling, Burke, Omega, are Performance, Backtesting & Validation concepts. The Library holds 1 implementation, a working definition you can pull into Quant.
Top Extended Risk-adjusted Ratios indicator
The top custom implementation, built on the original standard Extended Risk-adjusted Ratios formula.
1 total
This Extended Risk-adjusted Ratios implementation is strategy-ready: open it in Quant, set your rules, and it backtests automatically.
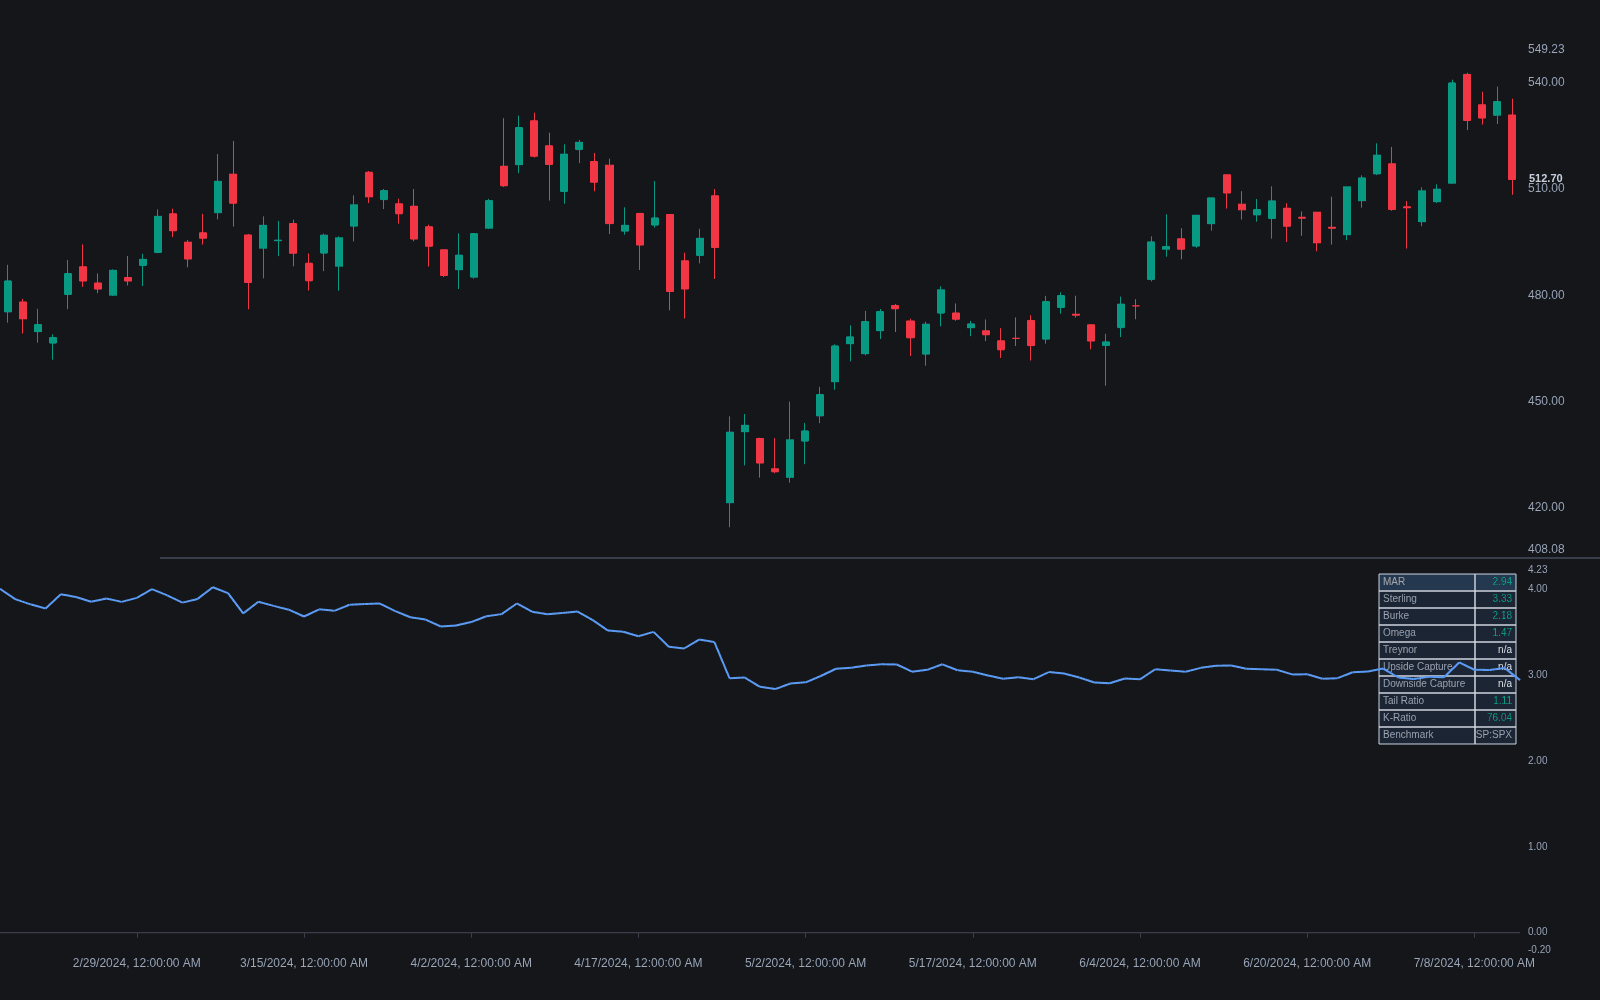
What are extended risk-adjusted ratios?
Extended risk-adjusted ratios are the long tail of performance measures beyond the standard Sharpe and Sortino ratios: the MAR and Sterling ratios, the Burke ratio, Omega, the Treynor ratio, upside and downside capture, the tail ratio, and the K-ratio, among others. Each divides some notion of reward by some notion of risk; they differ in which risk they penalize, a single drawdown, an average of drawdowns, downside deviation below a threshold, benchmark beta, or the raggedness of the equity curve.
This variety exists because no single denominator captures risk fully. Volatility ignores how losses bunch into prolonged drawdowns, maximum drawdown is one noisy event, and beta only matters relative to a benchmark. Practitioners therefore built families of measures: drawdown-family ratios (MAR, Sterling, Burke) for pain-based evaluation, distribution-based measures (Omega, tail ratio) for asymmetry and tails, benchmark-relative measures (Treynor, capture ratios) for portfolio context, and regression-based measures (K-ratio) for equity-curve consistency.
Traders care because different ratios expose different failure modes, and a strategy that looks strong on one axis can look poor on another. The equally honest point is that these measures are highly correlated in practice, each adds estimation noise, and screening across many ratios invites cherry-picking the flattering one. Most practitioners treat them as diagnostics supporting one or two primary metrics, not as independent evidence.
How it's calculated
There is no single formula; the standard forms of the most cited members are listed below.
The 10% cushion in the Sterling ratio is the original convention; modern variants often drop it.
Percentile choices for the tail ratio and the Omega threshold vary by implementation, so cross-source comparisons require matching definitions.
How traders use it
- Diagnostic second opinions: after ranking strategies by Sharpe or Calmar, practitioners check a drawdown-family and a tail-sensitive ratio to catch strategies whose headline number hides asymmetric risk.
- Benchmark-relative evaluation: Treynor and the capture ratios are used when a strategy lives inside a portfolio, asking whether it earns its keep relative to systematic exposure via beta rather than in isolation.
- Asymmetry screening: Omega and the tail ratio reward right-skewed return profiles, making them popular for evaluating trend-following and option-selling styles where volatility-based ratios mislead in opposite directions.
- Consistency checks: the K-ratio scores how straight the log equity curve is, flagging strategies whose returns came from one lucky burst rather than steady accumulation.
- Limitations: each extra ratio adds parameters and estimation error, definitions vary across software, and evaluating many correlated metrics on the same backtest inflates the odds of finding a spuriously flattering one.
Extended risk-adjusted ratios vs. related concepts
Sharpe Ratio: Sharpe is the common baseline that all of these extend: same reward-over-risk shape, but with volatility as the risk term. The extended family swaps the denominator for drawdowns, tails, or beta.
Martin Ratio: The Martin ratio belongs to the same drawdown family, using the root-mean-square of all drawdown depths as its risk term, arguably the most statistically stable of the drawdown denominators.
Information Ratio: The information ratio is benchmark-relative like Treynor, but divides active return by tracking error rather than by beta, measuring skill per unit of deviation from the benchmark.
Concept family
Performance, Backtesting & Validation
30 concepts mapped · 30 in the Library
Extended Risk-adjusted Ratios FAQ
Turn Extended Risk-adjusted Ratios into a trading strategy.
Take the implementation from this page into Quant, then build on it, backtest it on real data, and keep refining it in conversation.