Information Ratio
 By LuxAlgoJul 9, 2026
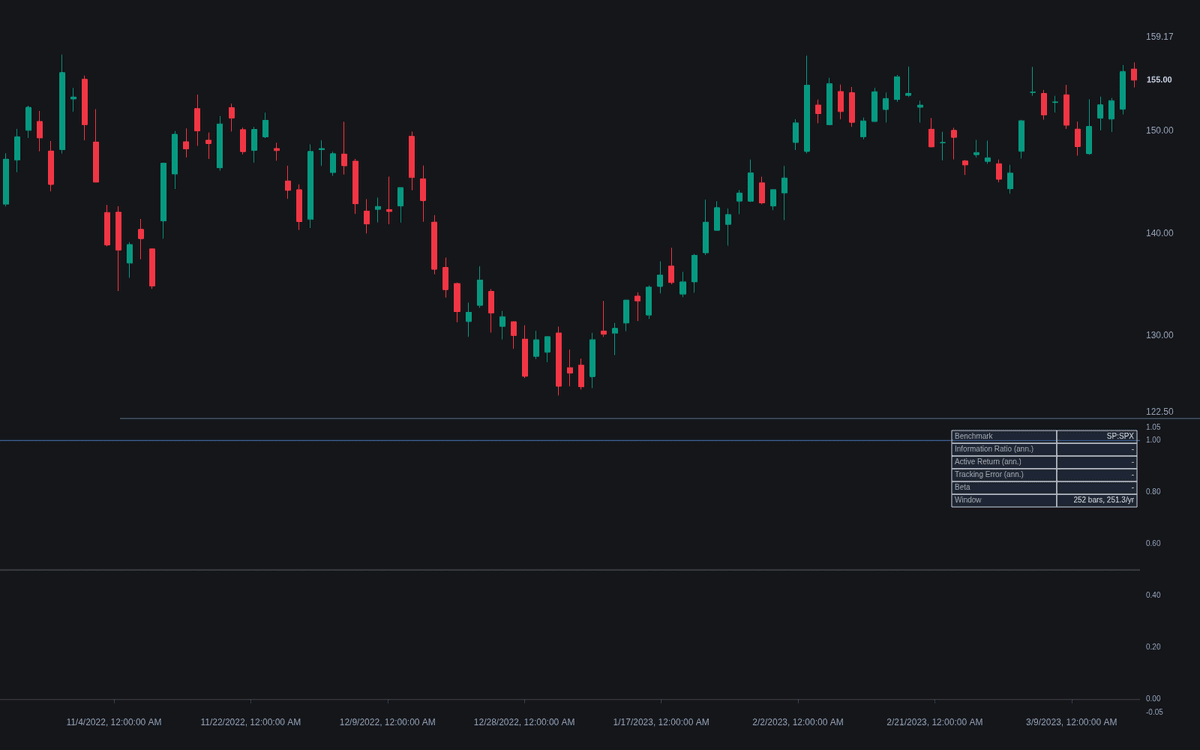
Information Ratio scores the chart symbol against a passive alternative, dividing its rolling mean active return by the variability of that same difference — a faithful rolling build of the information ratio. The Information Ratio line colors by sign with a gradient fill to zero, dashed references sit at the good and excellent levels, and a statistics table breaks the reading into benchmark, mean outperformance, deviation risk, beta and the annualization basis.
How to Trade the Information Ratio?
- Ratio above zero: the symbol is outperforming its benchmark over the window; below zero it is lagging. Crosses in both directions carry alerts.
- Reference levels: the dashed lines mark readings commonly quoted as good and excellent for sustained records, with crossing alerts.
- Table cross-check: a beta far from 1 means the symbol takes very different risk from its benchmark — where the two formulas part ways.
The reading only means something against the right yardstick, which is the discipline the validation family exists to enforce.
Information Ratio Settings
- Benchmark (default SP:SPX): the passive alternative; mismatch this and the ratio means nothing.
- Window Length (default 252): bars in the rolling mean and deviation.
- Formula (default Active Return / Tracking Error): the regression option divides alpha by residual risk instead.
- Return Type (default Simple): simple or logarithmic per-bar returns for both series.
- Annualize (default enabled) with Periods Per Year (default Auto) and Custom Periods Per Year (default 252): Auto infers the basis from average bar spacing.
- Good Level (default 0.5) and Excellent Level (default 1): the dashed references.
- Show Statistics Table (default enabled) with position and text-size options.
Frequently Asked Questions
How is this different from the Sharpe Ratio?
The Sharpe Ratio build grades returns against their overall volatility; this one grades outperformance against tracking error. One asks whether returns compensated risk at all, the other whether departing from the benchmark was worth it.
When should I switch to the regression formula?
When beta sits far from 1. The standard form charges the strategy for all benchmark-relative deviation, including plain leverage; alpha over residual risk isolates what selection added after the beta exposure is accounted for.
Why does my ratio swing so much?
A rolling window forgets: one strong or weak stretch dominates until it rolls out. Longer windows steady the reading at the cost of responsiveness; the table's window row shows the basis in use.

The Library is free. Quant makes it yours.
Pull any concept or indicator into Quant: rebuild it, retune it, or turn it into a backtested strategy of your own.