Concept
Information Ratio
Information Ratio is a Performance, Backtesting & Validation concept. The Library holds 1 implementation, a working definition you can pull into Quant.
Top Information Ratio indicator
The top custom implementation, built on the original standard Information Ratio formula.
1 total
Want to trade Information Ratio? The implementation below is one prompt away from a backtested strategy in Quant.
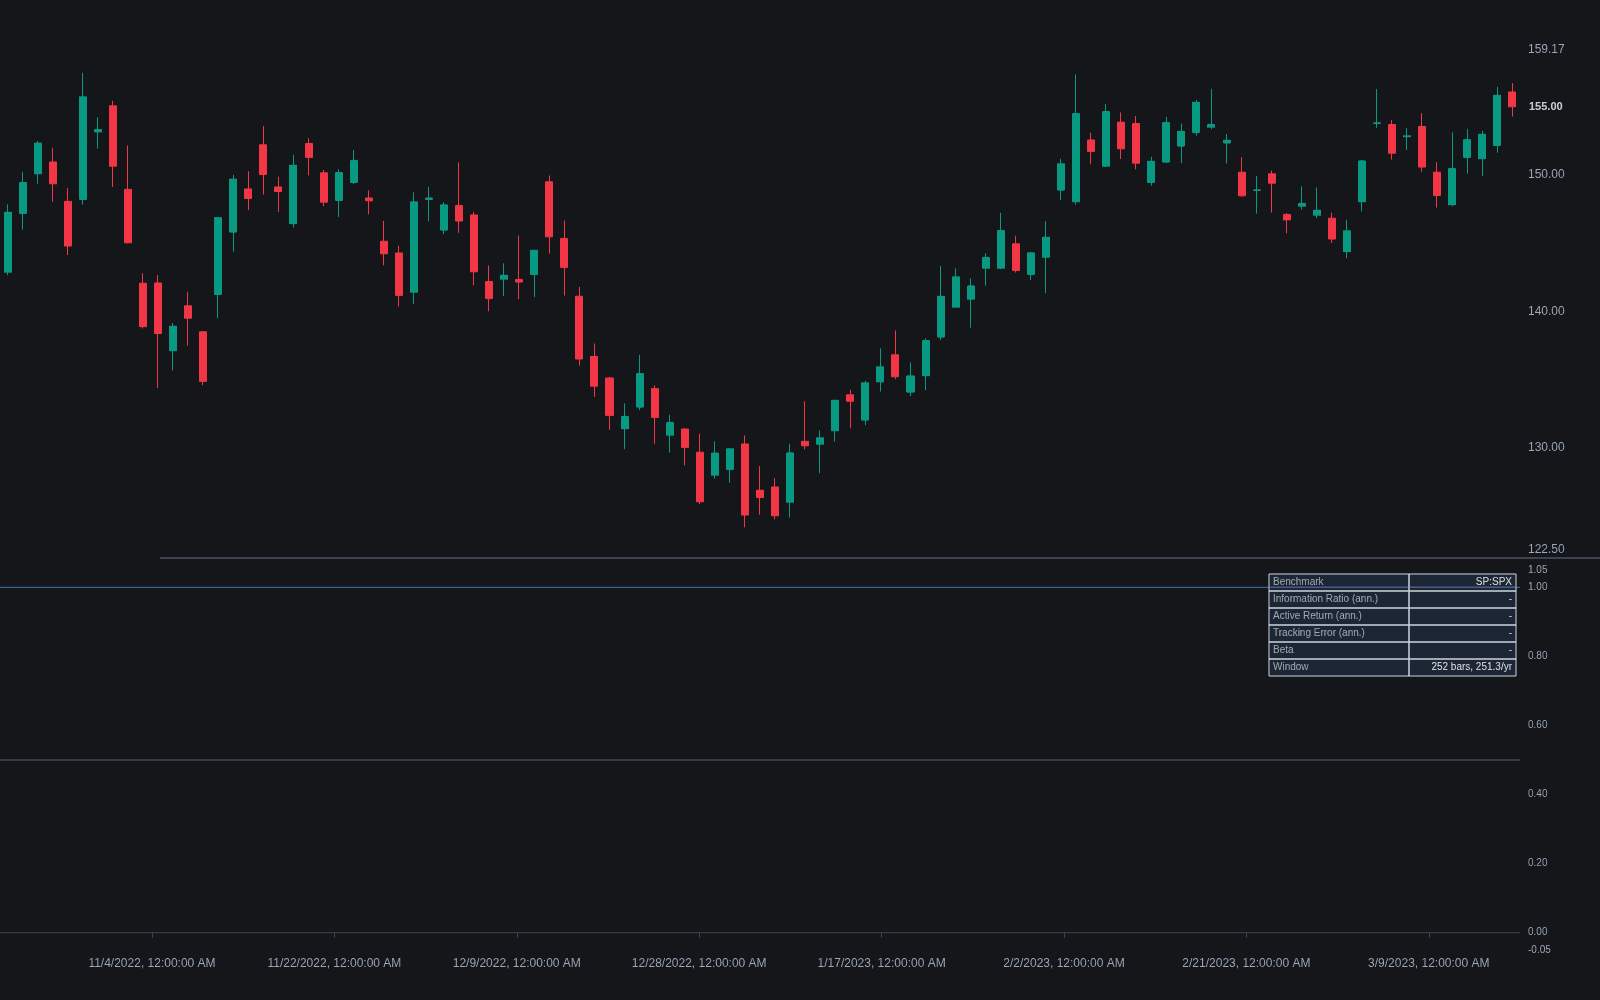
What is the information ratio?
The information ratio (IR) measures benchmark-relative skill: it divides a strategy's active return, its return minus the benchmark's, by the tracking error, the standard deviation of that same difference. Where the Sharpe ratio asks how much reward a strategy earns per unit of total volatility over cash, the information ratio asks how much outperformance it earns per unit of deviation from its benchmark.
The measure exists because beating a benchmark by taking wildly different risk is easy, while beating it consistently with controlled deviation is hard. A high IR means the departures from the benchmark were productive and steady rather than lucky and erratic. In institutional settings it is the canonical score for active managers, and it connects to the fundamental law of active management, which links IR to the product of skill per decision and the number of independent decisions taken.
Traders care because the same logic applies whenever a strategy claims to improve on a passive alternative: a stock system should be judged against buy-and-hold of its index, a crypto rotation system against holding BTC or a market-cap basket. Reporting absolute returns while ignoring what the benchmark did over the same window is one of the most common ways backtests flatter themselves, a failure of benchmark comparison discipline.
How it's calculated
The information ratio is active return divided by the variability of active return.
Annualize by multiplying a per-period IR by the square root of periods per year (e.g. sqrt(12) for monthly data).
Some definitions use regression alpha over residual risk instead of raw active return over tracking error; results differ when the strategy's beta is far from 1.
How traders use it
- Active-management evaluation: institutions rank managers by IR because it rewards consistent outperformance rather than outperformance bought with large benchmark deviations; values near 0.5 sustained over years are commonly considered good, and above 1.0 exceptional.
- Backtest honesty: retail system developers compute IR against buy-and-hold to test whether the strategy's complexity actually adds anything beyond owning the underlying market, particularly in long-biased equity and crypto systems.
- Signal comparison: when several signals or models target the same market, comparing IRs against the common benchmark identifies which one converts deviation into outperformance most efficiently, complementing alpha estimates.
- Limitations: the IR is entirely benchmark-dependent, so a mismatched benchmark renders it meaningless, and like the Sharpe ratio it assumes reasonably well-behaved return distributions and enough observations for the mean estimate to be trustworthy.
Information ratio vs. related concepts
Sharpe Ratio: Sharpe uses the risk-free rate as the reference and total volatility as risk; the IR uses a market benchmark as the reference and tracking error as risk. Sharpe scores the strategy in isolation, IR scores it as an active bet against an alternative.
Alpha: Alpha is the size of the benchmark-adjusted excess return; the information ratio is that excess scaled by its own variability. A strategy can have positive alpha but a poor IR if the outperformance arrives erratically.
Relative Strength Comparative: A comparative RS line charts the ratio of an instrument to its benchmark for visual analysis; the information ratio is the statistical summary of the same relationship, one number instead of a curve.
Concept family
Performance, Backtesting & Validation
30 concepts mapped · 30 in the Library
Information Ratio FAQ
Turn Information Ratio into a trading strategy.
Take the implementation from this page into Quant, then build on it, backtest it on real data, and keep refining it in conversation.