Live Decay Tracking
 By LuxAlgoAug 9, 2026
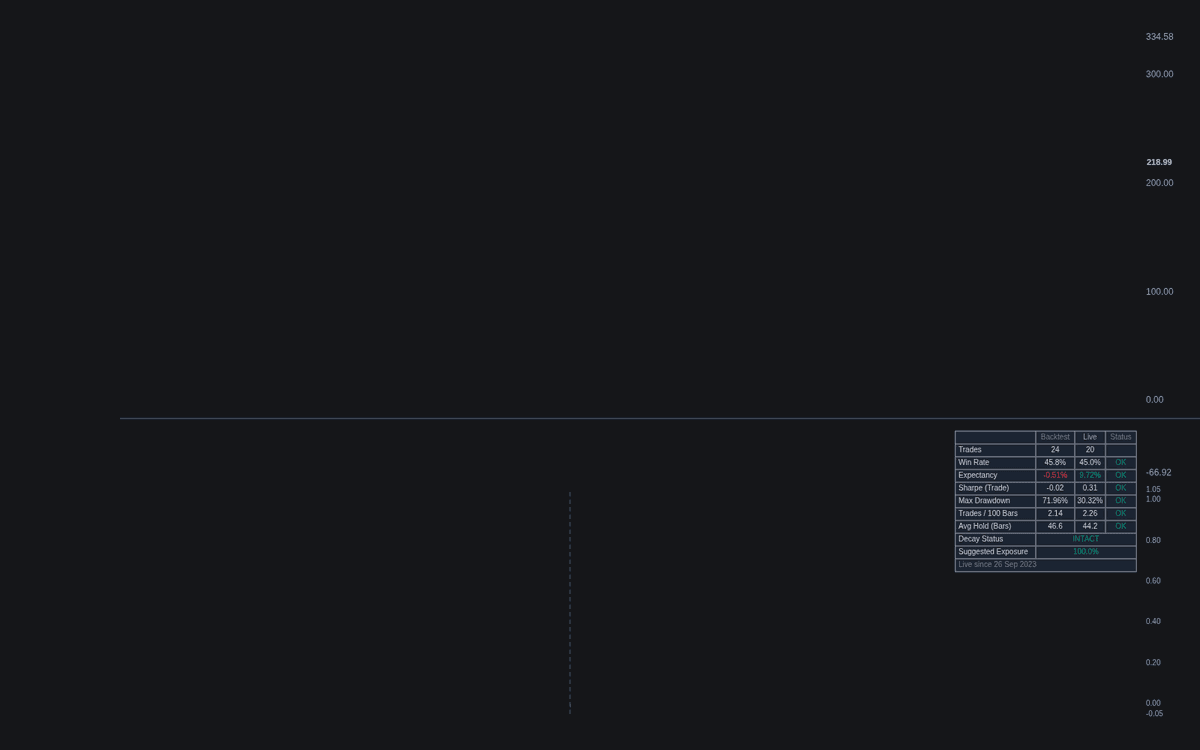
Live Decay Tracking answers the question every deployed system forces: is the recent slump an ordinary cold streak, or evidence the edge is gone? A reference strategy's closed trades split into backtest and live samples, and Monte Carlo resampling of the backtest establishes how low a rolling window can sink by chance alone - the pre-committed comparison at the heart of live decay tracking. The rolling metric plots against the resampled median and bands, the backdrop tinting amber on watch, red on breach.
How to Trade the Live Decay Tracking?
- INTACT / WATCH / DECAY: the dashboard verdict - inside the resampled range, below the watch percentile or drifting, or beyond a pre-committed limit.
- Band breach: a close below the lower band counts as decay evidence, not noise - the threshold was fixed before live data arrived.
- Input drift: signal frequency or holding period drifting beyond tolerance often flags regime change before profits do.
Live Decay Tracking Settings
- System (default Moving Average Cross; also RSI Mean Reversion, Donchian Breakout) with Fast MA (default 20), Slow MA (default 50), RSI Length (default 14), Donchian Length (default 20) and Slippage % Per Side (default 0.02).
- Split Mode (default Most Recent Trades) with Live Window (Trades) (default 20) and Deployment Date (default 01 Jan 2025).
- Tracked Metric (default Expectancy; also Sharpe Ratio, Win Rate) over a Rolling Window (Trades) (default 20).
- Monte Carlo Runs (default 250), Band Percentile (default 5), Watch Percentile (default 25), Min Backtest Trades (default 10), Input Drift Tolerance % (default 50), Monte Carlo Seed (default 1).
- Show Dashboard (on, Top Right, Small) plus band, marker, gradient and backdrop toggles.
Frequently Asked Questions
How is this different from Walk-forward Analysis?
Walk-forward Analysis validates before deployment, re-fitting and testing across rolling segments. Decay tracking starts where walk-forward ends: the system is live, the bands are committed, and the question is whether live results still look like the backtest.
Can it track my own strategy?
The trade stream comes from the built-in reference systems - configure the closest proxy. Anchored Date mode matters most: the sample frozen at the deployment date commits the bands before the live evidence arrives.
Why Monte Carlo bands instead of a fixed threshold?
Every edge spends stretches below expectations by chance; how far below depends on its trade distribution. Resampling answers how bad a rolling window can look with the edge intact - the band is a percentile of that answer.

The Library is free. Quant makes it yours.
Pull any concept or indicator into Quant: rebuild it, retune it, or turn it into a backtested strategy of your own.