Martingale / Anti-martingale
 By LuxAlgoAug 9, 2026
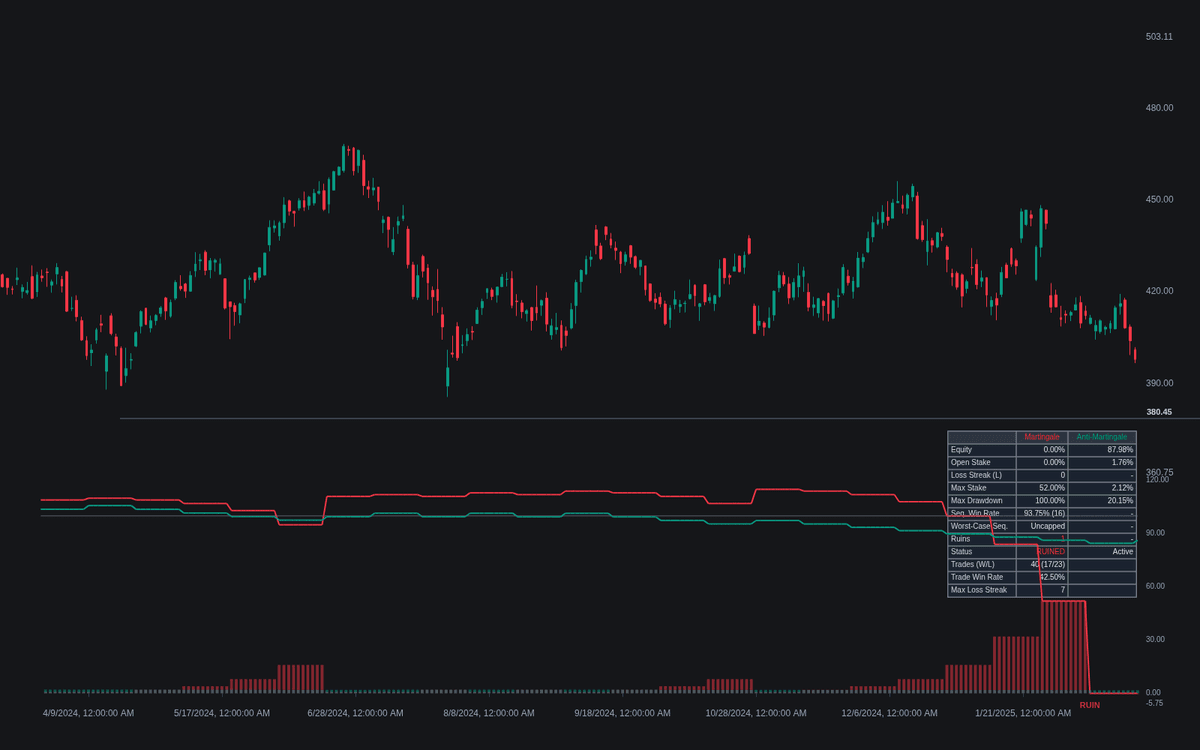
Martingale / Anti-martingale runs both sides of the oldest position-sizing argument on one chart — the first faithful implementation of martingale and anti-martingale sizing in the library. Two accounts size one identical stream of even-money trades in opposite ways: the martingale multiplies its stake after every loss, the anti-martingale risks a fixed fraction of its current equity. Both equity curves plot around a dotted Initial Capital line, open stakes as columns underneath.
How to Trade the Martingale / Anti-martingale?
- Equity Gap Fill: the shading between the curves takes the leading scheme's color — watch how smooth the martingale curve looks right up to the streak that ends it.
- RUIN label: prints when the martingale account can no longer fund its base stake; Restart After Ruin resets it so repeated catastrophes stay countable.
- Loss Streak Threshold alert: fires at the set number of consecutive losses — where stake escalation compounds fastest.
A risk and exit study tool: the direction rule exists only to supply wins and losses.
Martingale / Anti-martingale Settings
- Direction Rule (default Momentum): with the SMA trend, against it, or Always Long.
- Direction SMA Length (default 50) and Bars Per Trade (default 10): trend reference and holding period; an unchanged close is a scratch.
- Base Stake (% of Initial Capital) (default 1.0) and Loss Multiplier (m) (default 2.0): stake = base × m^L after L straight losses.
- Exposure Cap (default None (Classic)) with Cap After K Consecutive Losses (default 5): freeze the stake or abort the sequence after K losses.
- Fixed Fraction f (% of Equity) (default 2.0): the anti-martingale's per-trade risk.
- Restart After Ruin (off), Loss Streak Alert Level (default 5), plus dashboard and style toggles (Stake Columns, Equity Gap Fill, Ruin Label, all on).
Frequently Asked Questions
Why do both schemes trade identical signals?
To isolate sizing from strategy. Any edge or flaw in the direction rule hits both accounts equally, so every difference between the curves comes from the sizing scheme alone.
What does the Worst-Case Seq. row show?
With Abort Sequence selected, the bounded loss of one full losing sequence: base × (m^K − 1) / (m − 1). Under the other modes it reads Uncapped, the classic scheme's open-ended worst case.
How does this relate to risk of ruin?
Directly — the RUIN events this simulator prints are the outcome that risk of ruin arithmetic prices in advance. Escalating stakes through a streak push that probability toward certainty on finite capital.

The Library is free. Quant makes it yours.
Pull any concept or indicator into Quant: rebuild it, retune it, or turn it into a backtested strategy of your own.