Model Overfitting
 By LuxAlgoAug 9, 2026
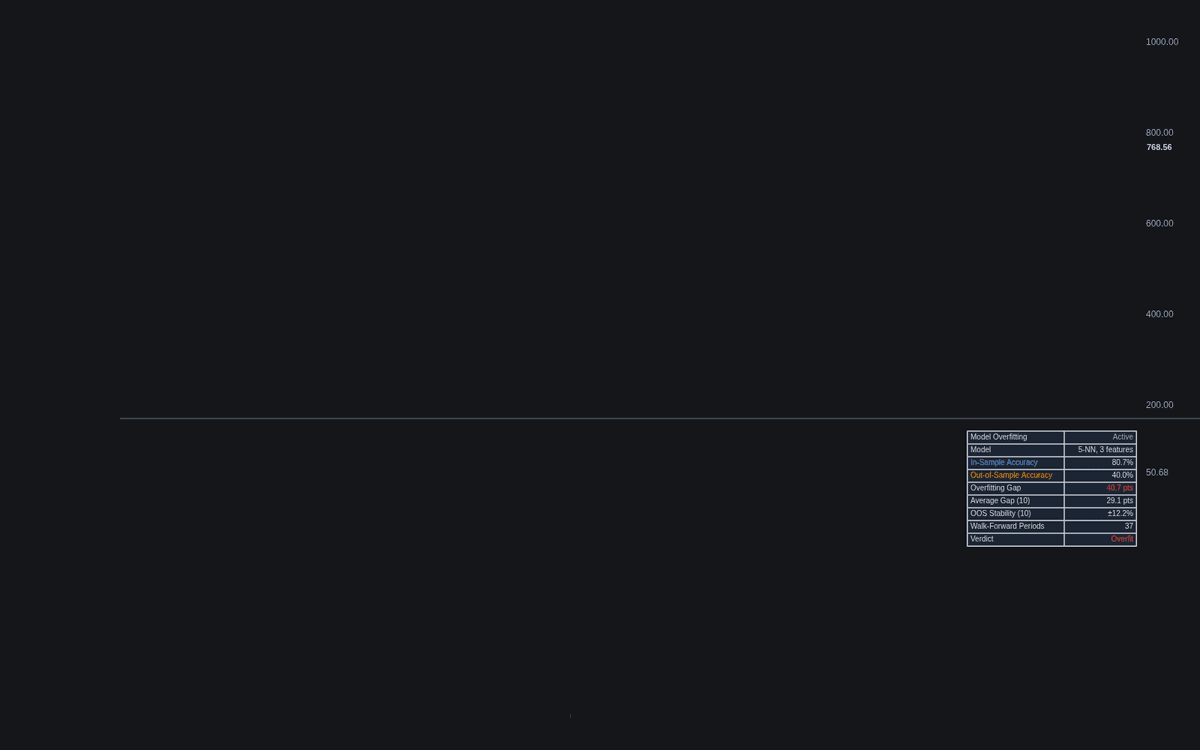
Model Overfitting demonstrates the most expensive failure in quantitative work on the symbol you actually trade. An embedded k-nearest-neighbors classifier predicts bar direction from standard features, and each walk-forward period it is scored twice: on the window it was fitted to, and on newer samples it never saw. The spread between those accuracies — the generalization gap at the heart of model overfitting — plots as columns heating toward the overfit color, beneath the two accuracy steplines and a dotted 50% chance level.
How to Trade the Model Overfitting?
- Gap at the threshold: the latest period is flagged Overfit, with alerts on the transition and recovery.
- Memorized verdict: near-perfect in-sample with near-chance out-of-sample accuracy; set Neighbors (k) to 1 to produce the signature on demand.
- OOS Stability: wildly swinging out-of-sample accuracy is itself a symptom; the dashboard reports its spread.
Model Overfitting Settings
- Neighbors (k) (default 5): the capacity dial — small k fits the training window tightly, larger k generalizes more smoothly.
- Prediction Horizon (default 5): bars ahead each sample is labeled on.
- Training Window (default 150) and Held-Out Window (default 50): the fitted and scored segments; a new evaluation runs as each held-out batch completes.
- Overfitting Gap Threshold (default 15): percentage points of gap that flag a period as overfit.
- Stability Lookback (default 10): completed periods behind the average-gap and stability rows.
- Features — Momentum (on, Length 14), RSI (on, Length 14), Volatility (on, Length 20), Relative Volume (off, Length 20): each enabled feature adds capacity to fit noise.
- Show Dashboard (on) with location and size; style toggles Gap Columns and Accuracy Gap Fill (both on).
Frequently Asked Questions
How does this relate to walk-forward analysis?
Same discipline, different subject. Walk-forward analysis rolls a strategy's parameters forward and judges only unseen data; this build applies the identical split to a classifier so the gap itself becomes the chart's subject.
Why is in-sample accuracy so high?
By design: the training score is resubstitution — each sample may count among its own neighbors — which is what makes memorization visible. At k = 1 the classifier recalls its training window perfectly while proving nothing about new data.
Should I trade the classifier's predictions?
No — it exists to be measured, not followed. The instructive output is the gap: watching accuracy collapse out of sample on your own symbol argues for validation discipline better than any textbook example.

The Library is free. Quant makes it yours.
Pull any concept or indicator into Quant: rebuild it, retune it, or turn it into a backtested strategy of your own.