Robustness Testing
 By LuxAlgoJul 6, 2026
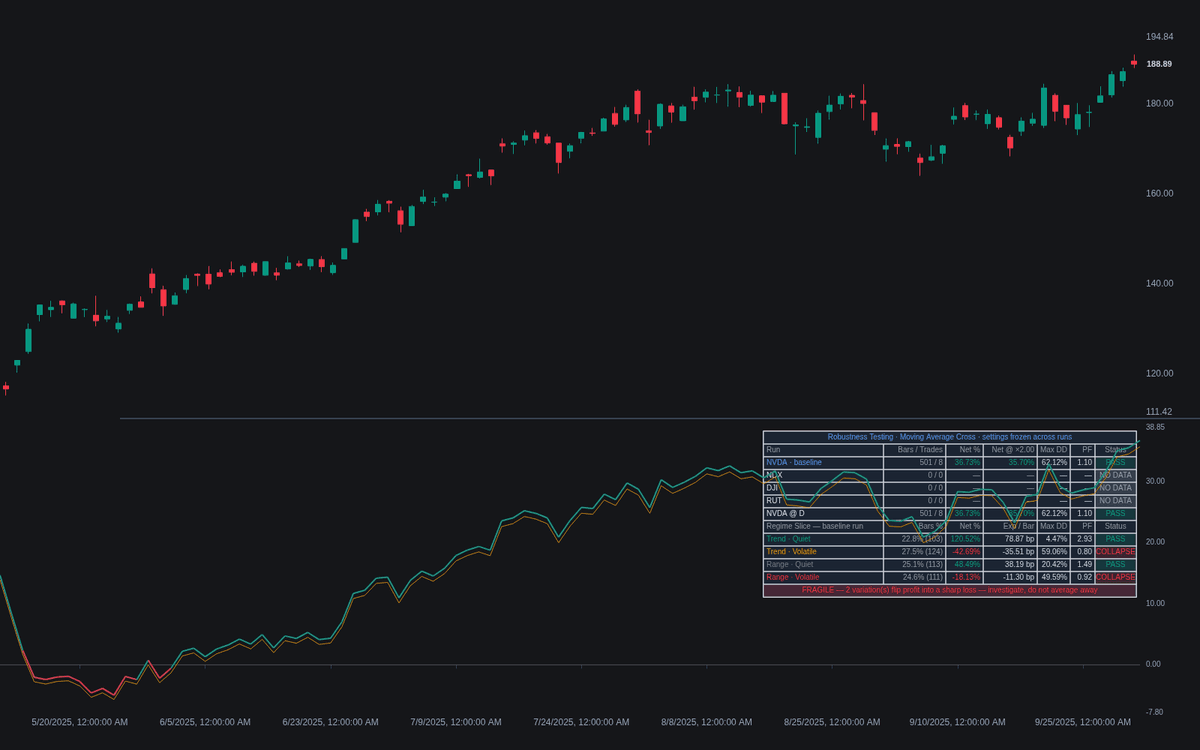
Robustness Testing asks a strategy one question: does the edge travel? A frozen rule set — one parameter file, never re-tuned — is re-run on the chart, up to five related markets, an alternate timeframe, four trend/volatility regime slices and a stressed cost multiple: the robustness testing battery. Equity curves overlay per run, the backdrop shades with the regime, and a matrix dashboard grades the battery ROBUST when degradation is graceful, MIXED, or FRAGILE — COLLAPSE flagged on runs flipping profit into sharp loss.
How to Trade the Robustness Testing?
- Verdict row: read it against criteria fixed beforehand; requiring a pass in every cell is itself curve-fitting.
- COST-FRAGILE: profitable at base cost but not at the stress multiple — live friction may eat the edge; alerted for the baseline.
- Regime shifts: the Regime Changed alert prompts a check of the new slice's record before trusting signals in it.
It belongs in a wider validation family pass.
Robustness Testing Settings
- Entry Rule (default Moving Average Cross), Average Type (default EMA), Fast Length (default 20), Slow (default 50); RSI Length (default 14), RSI Buy Level (default 30), Sell (default 70); Breakout Length (default 20); Trade Direction (default Long & Short).
- Market 1-Market 5 (NASDAQ:NDX, TVC:DJI, TVC:RUT on by default) and the Alternate Timeframe run (default D).
- ADX Length (default 14), Threshold (default 25), ATR Length (default 14), Vol Median Window (default 100): the regime grid.
- Base Cost per Side (%) (default 0.05) and Stress Multiplier (×) (default 2).
- Minimum Tested Bars (default 200), Minimum Pass Rate (%) (default 70), Collapse Threshold (%) (default -10).
- Show Dashboard (on), Position (Top Right), Text Size (Small); toggles for the stressed-cost curve, variation curves, regime background.
Frequently Asked Questions
How does this differ from Randomization Tests?
The Randomization Tests build attacks luck inside one backtest by reshuffling its trades. This build attacks specificity by re-running frozen rules elsewhere.
Why are the settings frozen across runs?
Tuning each symbol separately hands the optimizer fresh chances to memorize noise — the exact failure this battery exposes. One parameter file holding its shape across the basket beats a deeper backtest on one symbol.
What do THIN and NO DATA mean?
Runs under the bar minimum, or regime slices with too small a bar share, are shown but not scored — short histories are noise, not evidence. NO DATA marks a symbol returning nothing.

The Library is free. Quant makes it yours.
Pull any concept or indicator into Quant: rebuild it, retune it, or turn it into a backtested strategy of your own.