Significance of Returns
 By LuxAlgoMay 26, 2026
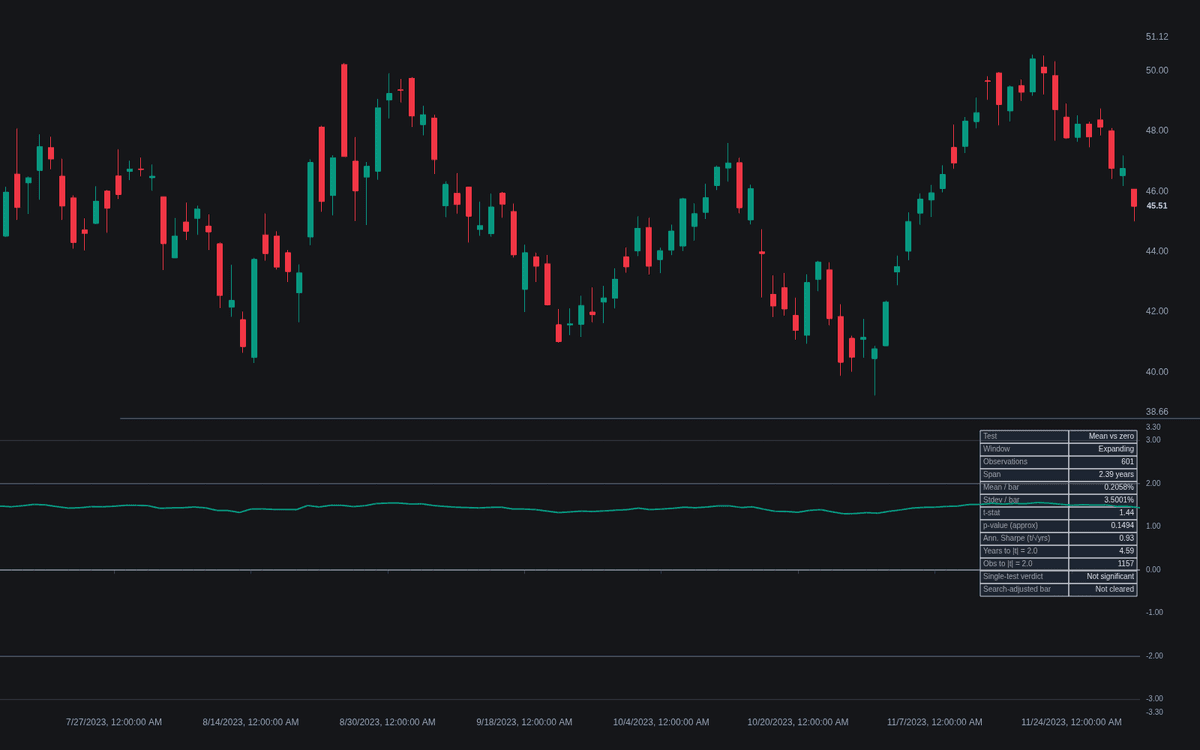
Significance of Returns turns the question every equity curve begs — skill or luck? — into a line on the chart. It accumulates per-bar returns of any series, computes the one-sample t-statistic of their mean, and plots it against the two bars of the significance of returns framework: a single-test level near 2 and a raised search-adjusted level near 3. Readings hide until a minimum sample accumulates, and the dashboard supplies honest context: observations, span, approximate p-value, implied annualized Sharpe, and the years or observations the current edge needs to clear the bar.
How to Trade the Significance of Returns?
- |t| beyond 2: the mean return clears the conventional single-test bar, roughly 5% two-sided — alerted on both signs and directions.
- |t| beyond 3: the search-adjusted bar for strategies selected among many tested variants.
- Inside the bars: the honest default — an edge indistinguishable from noise on the current sample.
- Source flexibility: point Source at another plot — an equity curve, say — to test its returns instead of price.
Significance of Returns Settings
- Source (default close) and Return Type (default Percent).
- Test Against (default Zero) with Benchmark (default SP:SPX): test the mean against zero, or excess returns over a benchmark.
- Window Mode (default Expanding) with Rolling Observations (default 252): growing track record versus recent monitoring.
- Anchor Expanding Window (default off) with Anchor Date (default 1 Jan 2024): start the sample at a chosen inception.
- Minimum Observations (default 30): readings hide below this sample.
- Single-Test Threshold (default 2) and Search-Adjusted Threshold (default 3): the drawn and alerted levels.
- Show Dashboard (on); style: Gradient Fill and Show Significance Levels (both on).
Frequently Asked Questions
How does this relate to the SQN?
Same arithmetic — sqrt(n) times mean over standard deviation — different sample. The SQN build scores closed-trade R-multiples and grades them on Tharp's bands; this one tests raw bar returns of any plotted series and reports p-values and sample planning instead of grades.
Why does the t-statistic drift upward on a long chart?
Because at any constant edge t climbs with √n — the dashboard's t/sqrt(years) row makes the link explicit. The rolling mode monitors recent performance without that accumulation.
Which threshold should I hold a strategy to?
Specified once and tested once: the single-test level near 2 is the convention. Picked from a search: research practice commonly raises the bar to 3 or more — the level the search-adjusted verdict applies.

The Library is free. Quant makes it yours.
Pull any concept or indicator into Quant: rebuild it, retune it, or turn it into a backtested strategy of your own.