Concept
Significance of Returns
Significance of Returns, also known as t-stat, are Performance, Backtesting & Validation concepts. The Library holds 1 implementation, a working definition you can pull into Quant.
Top Significance of Returns indicator
The top custom implementation, built on the original standard Significance of Returns formula.
1 total
From studying Significance of Returns to trading it: take the implementation below into Quant and backtest it instantly.
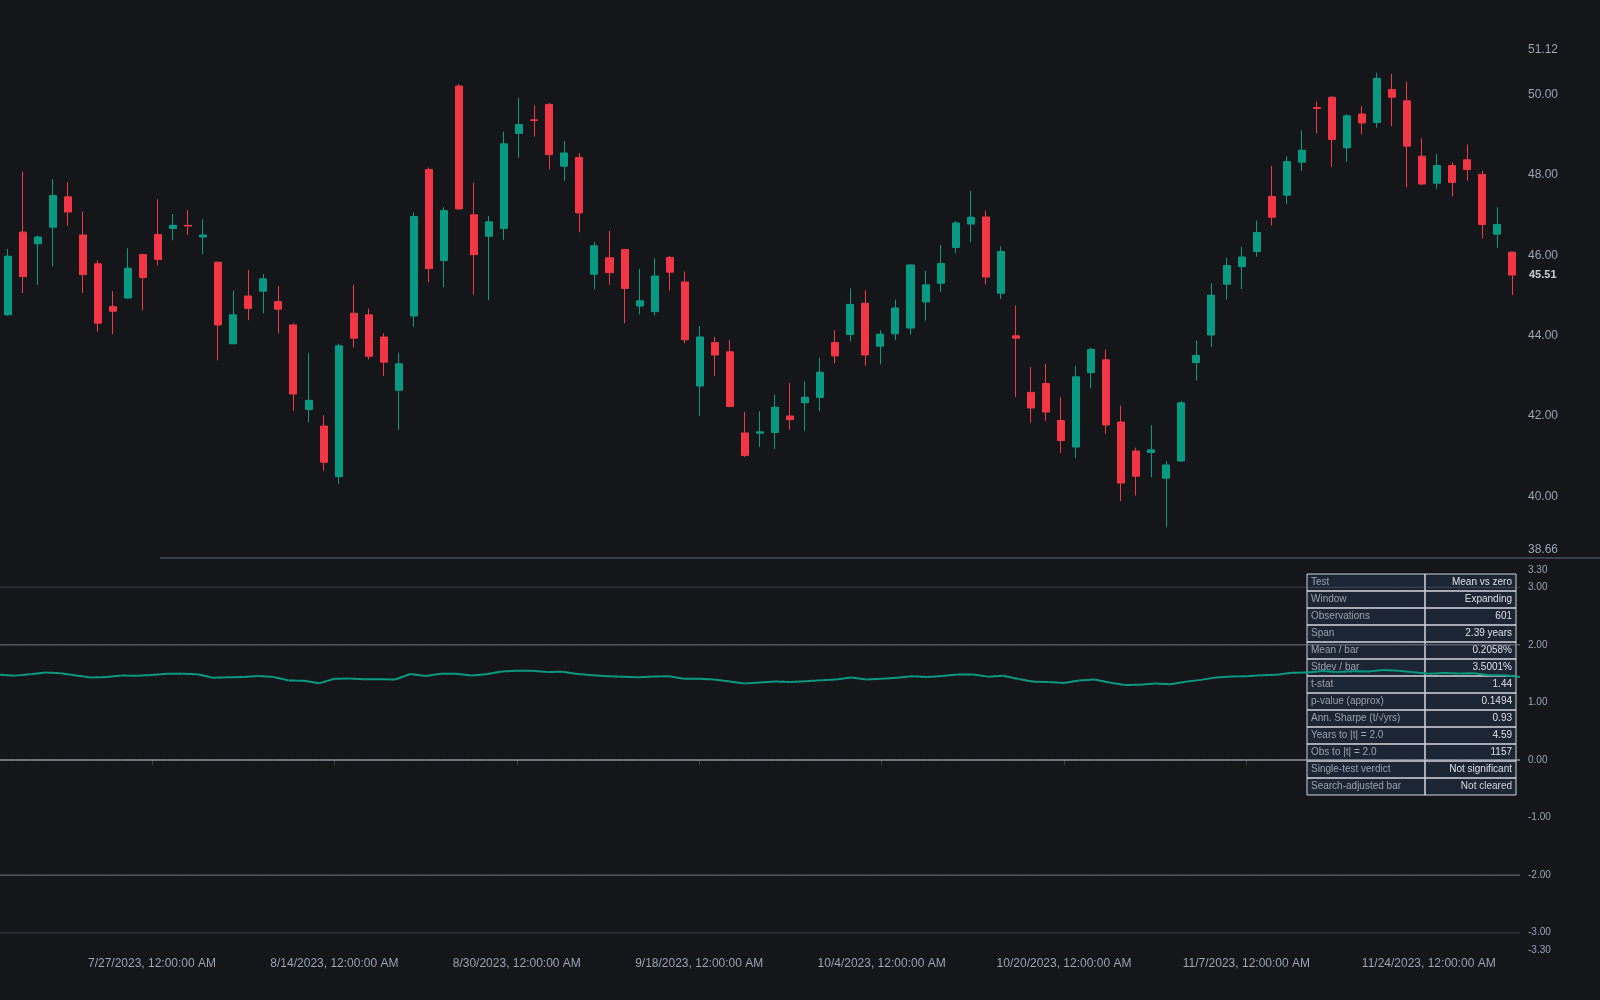
What is statistical significance of returns?
Statistical significance of returns is the practice of testing whether a strategy's average return is distinguishable from zero, or from a benchmark, given the noise in the data. The workhorse is the t-statistic (t-stat): the mean period return divided by its standard error. A large t-stat says the observed edge is unlikely to be pure sampling luck; a small one says the backtest's profit is entirely consistent with a strategy that has no edge at all.
The test exists because market returns are extremely noisy relative to the edges traders hunt. A system can post several profitable years by chance, and the human eye is poor at separating a real 0.05 percent daily edge from a lucky run. The t-stat formalizes the question, and it connects directly to the Sharpe ratio: the t-stat of mean returns is approximately the annualized Sharpe times the square root of the number of years, which is why short track records cannot statistically validate modest Sharpe strategies no matter how good they look.
Traders care because significance testing is the first honesty gate in validation. Its central trap is selection: a t-stat threshold of about 2 is calibrated for a single pre-specified test, but strategy development tries hundreds of variants, so the best backtest among many will clear that bar by luck alone. This is why practitioners raise the bar via multiple-testing corrections or use the deflated Sharpe ratio, which adjusts for the number of trials.
How it's calculated
The one-sample t-statistic tests whether the mean return differs from zero.
The classical test assumes independent, roughly normal returns; autocorrelation and fat tails distort it, which motivates block bootstrap and permutation alternatives.
A t-stat near 2 corresponds to roughly 5 percent two-sided significance for a single test only; after searching many variants the effective bar must be much higher.
How traders use it
- Edge verification: before trusting a backtest, practitioners compute the t-stat of per-trade or daily returns; a value under about 2 means the sample cannot distinguish the system from a no-edge coin flip, whatever the equity curve looks like.
- Sample-size planning: inverting the Sharpe relation tells a developer how many years of data are needed to validate a given edge, for example a Sharpe near 0.5 needs on the order of 16 years to reach a t-stat of 2, which tempers enthusiasm for short tests.
- Search-adjusted thresholds: teams that test many variants raise the required t-stat, apply corrections for the number of trials, or switch to randomization tests and resampling methods that need fewer distributional assumptions.
- Live monitoring: the same machinery applied to live returns tests whether performance is consistent with the backtest or with zero edge, though the low power of small live samples means it flags disasters faster than it confirms success.
- Limitations: significance is not economic importance, a tiny edge can be significant yet untradable after costs, and no t-stat can rescue a test contaminated by lookahead, survivorship bias, or unrealistic fills.
Significance of returns vs. related concepts
Deflated Sharpe Ratio: The deflated Sharpe ratio is a significance test purpose-built for strategy selection: it adjusts the Sharpe's apparent significance for the number of trials, non-normality, and track length, where the plain t-stat assumes a single pre-specified test.
Randomization Tests: Randomization and permutation tests estimate significance empirically by destroying the signal-return alignment and re-scoring, avoiding the normality and independence assumptions the classical t-test leans on.
Win Rate: Win rate summarizes how often trades profit but says nothing about whether the overall mean return beats chance; a 60 percent win rate with poor payoffs can still fail a significance test of returns.
Concept family
Performance, Backtesting & Validation
30 concepts mapped · 30 in the Library
Significance of Returns FAQ
Turn Significance of Returns into a trading strategy.
Take the implementation from this page into Quant, then build on it, backtest it on real data, and keep refining it in conversation.