Sortino Ratio
 By LuxAlgoJul 23, 2026
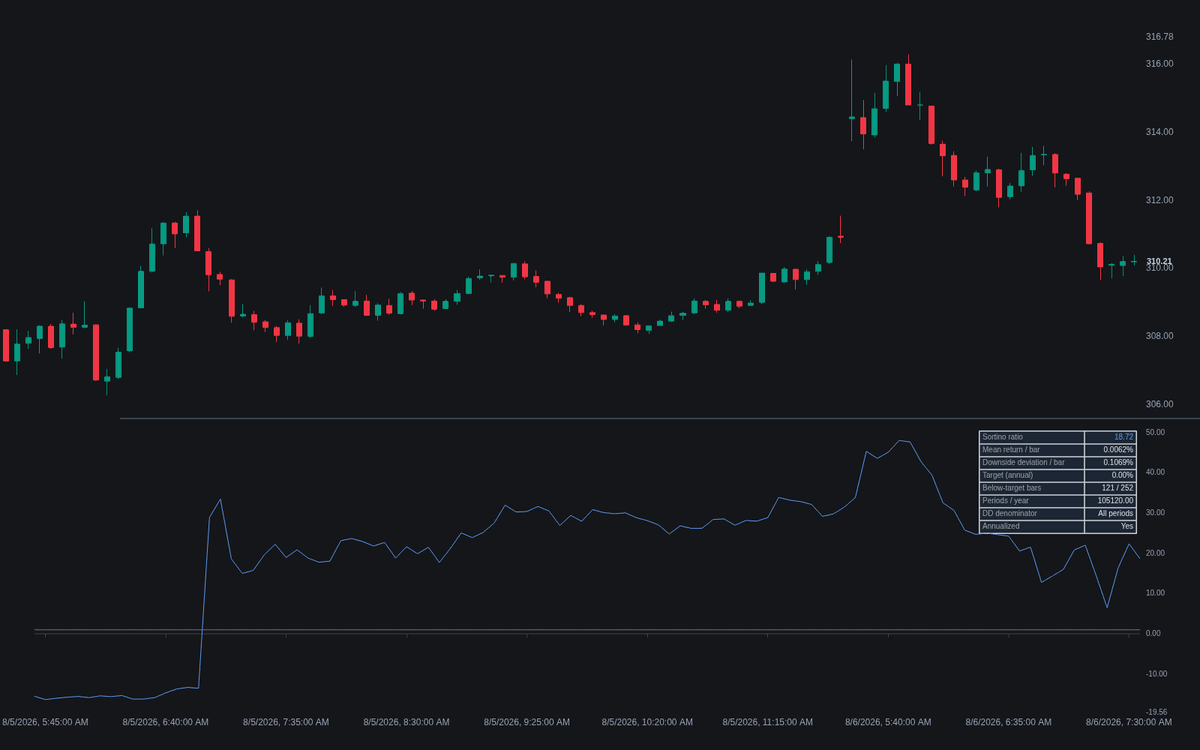
Sortino Ratio measures reward against the only volatility investors actually mind — the downside — as a rolling line. Each bar it computes the mean return over the window, subtracts the de-annualized target, and divides by a downside deviation built solely from below-target periods, the defining move of the Sortino ratio. The line plots with a gradient fill against a dotted zero and a dashed threshold, and because the number is famously convention-sensitive, a dashboard states every choice in force: target, denominator, periods per year, annualization, and how many below-target bars the downside estimate rests on.
How to Trade the Sortino Ratio?
- Above zero: the average return over the window beats the target; below zero it trails it — both crossings are alerted.
- Threshold Level: the dashed reference (default 1.0) frames a solid annualized reading on live returns; crossings fire alerts in both directions.
- Watch the below-target count: the downside estimate rests on the below-target subset alone, so the dashboard row turns warning-colored when fewer than 10 bars feed it — treat those readings as fragile.
Sortino Ratio Settings
- Source (default close), Length (default 252) and Returns Type (default Simple).
- Target Return (Annual %) (default 0): the minimum acceptable return, de-annualized to a per-bar target.
- Downside Deviation Denominator (default All periods (n)): divide squared shortfalls by all periods, or by below-target periods only — the two conventions differ materially.
- Annualize (default on) with Periods Per Year (default Auto) and Custom Periods Per Year (default 252).
- Threshold Level (default 1.0): the drawn and alerted reference.
- Show Dashboard (on); style: Gradient Fill (on).
Frequently Asked Questions
When is Sortino better than Sharpe?
Whenever upside volatility should not count against a strategy. The Sharpe Ratio divides by total return dispersion, so explosive winning streaks depress it; the Sortino penalizes only below-target outcomes, which suits asymmetric return profiles like trend-following.
Why does my reading differ from a published Sortino?
Almost always conventions: a different target, the other denominator, log versus simple returns, or no annualization. Match the dashboard's stated basis to the published methodology before comparing numbers.
Should the target be zero, or should it match the risk-free rate?
Zero asks whether returns are positive in absolute terms; a risk-free target asks whether they beat parking the capital. Both are legitimate minimum acceptable returns — state which one a quoted figure uses, since that choice moves the number.

The Library is free. Quant makes it yours.
Pull any concept or indicator into Quant: rebuild it, retune it, or turn it into a backtested strategy of your own.