Concept
Sortino Ratio
Sortino Ratio is a Performance, Backtesting & Validation concept. The Library holds 1 implementation, a working definition you can pull into Quant.
Top Sortino Ratio indicator
The top custom implementation, built on the original standard Sortino Ratio formula.
1 total
Want to trade Sortino Ratio? The implementation below is one prompt away from a backtested strategy in Quant.
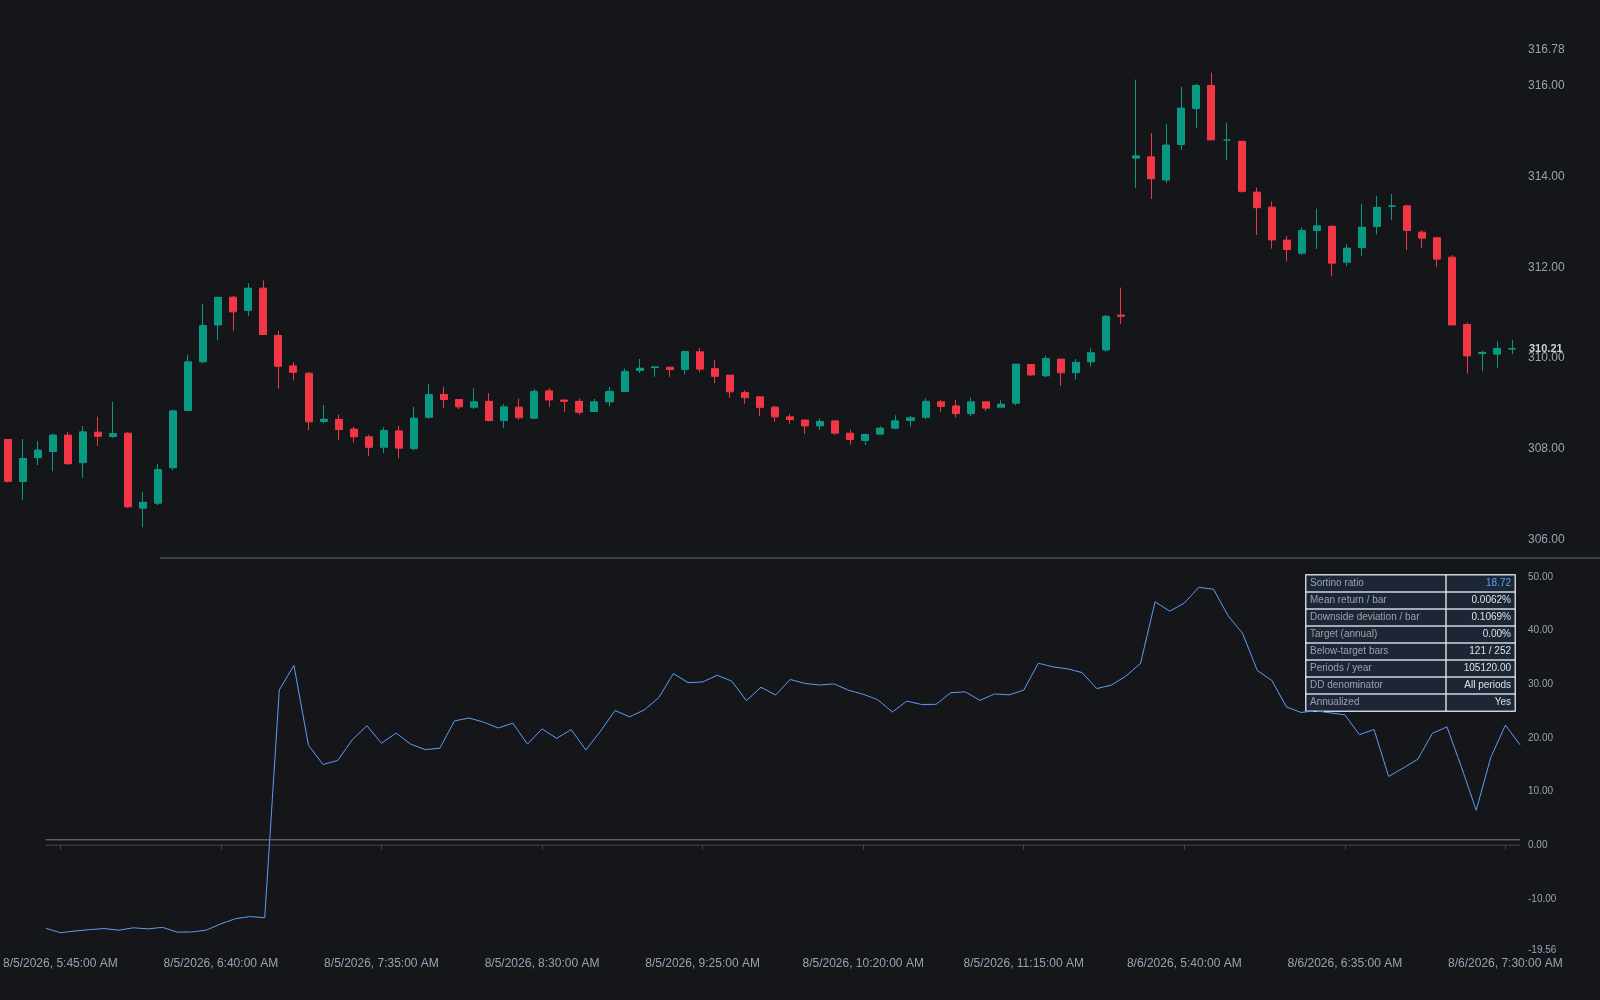
What is the Sortino Ratio?
The Sortino ratio measures return per unit of downside risk. It divides a strategy's excess return over some target by the downside deviation, a volatility measure computed only from periods that fell short of that target. The design responds to a long-standing complaint about the Sharpe ratio: ordinary standard deviation penalizes large gains exactly as it penalizes large losses, so a strategy with occasional explosive winners can look riskier than one that bleeds steadily.
The ratio is named after Frank Sortino, whose work on downside-risk measurement at the Pension Research Institute in the 1980s built on the older idea that investors care about falling below a minimum acceptable return, not about variability as such. In practice the target is often set to zero or to the risk-free rate, and the resulting number is read the same way as a Sharpe ratio: higher is better, with the ranking of strategies sometimes changing once upside volatility stops counting against them.
Traders care about the Sortino ratio mainly when return distributions are asymmetric. Trend-following and long-option-style systems, which take many small losses and rare large wins, tend to score relatively better on Sortino than on Sharpe. The reverse holds for strategies that harvest small steady gains while carrying tail risk; a Sortino computed on a history that has not yet included the bad tail can look deceptively strong, which is a data problem no ratio fixes.
How it's calculated
The standard form divides average excess return over a target by the downside deviation of returns below that target.
Annualize by multiplying by the square root of periods per year, as with the Sharpe ratio.
Implementations vary on whether DD divides by all n periods (the common convention) or only by the count of below-target periods; the two can differ materially, so compare like with like.
How traders use it
- As a companion to the Sharpe ratio when comparing backtests: a large gap between the two flags an asymmetric return distribution worth inspecting directly rather than summarizing.
- For ranking strategies whose profits arrive in bursts, such as breakout or trend systems, where penalizing upside volatility would understate quality.
- As a vetting threshold alongside drawdown statistics, since downside deviation and maximum drawdown capture different aspects of pain.
- With caution on short histories: downside deviation is estimated from the subset of losing periods, so it is noisier than full-sample volatility and needs more data to stabilize.
- Not as a substitute for tail-risk analysis; a strategy that has not yet shown its worst losses can post an excellent Sortino right up until it does.
Sortino ratio vs related metrics
Sharpe Ratio: Sharpe divides by total volatility, Sortino only by downside deviation. On symmetric returns they rank strategies similarly; on skewed returns Sortino rewards upside outliers that Sharpe penalizes.
Calmar Ratio: Calmar divides annual return by maximum drawdown, a single worst-case path statistic, while Sortino uses the whole distribution of below-target returns. Calmar is more sensitive to one bad episode; Sortino to the general shape of losses.
Ulcer Index: The Ulcer Index measures the depth and duration of drawdowns over time rather than per-period downside deviation, so it captures how long capital sat underwater, which Sortino ignores.
Concept family
Performance, Backtesting & Validation
30 concepts mapped · 30 in the Library
Sortino Ratio FAQ
Turn Sortino Ratio into a trading strategy.
Take the implementation from this page into Quant, then build on it, backtest it on real data, and keep refining it in conversation.