
Learn how ascending and descending triangles can signal price movements, and discover effective trading strategies for these patterns.
Triangle patterns are key tools in technical analysis, helping traders predict price movements. They form during periods of consolidation and signal potential breakouts or breakdowns. The two main types are:
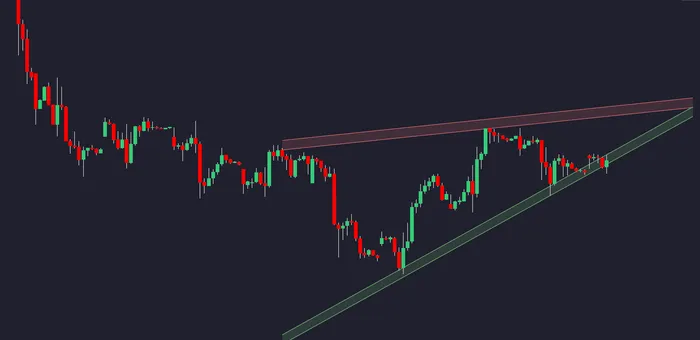
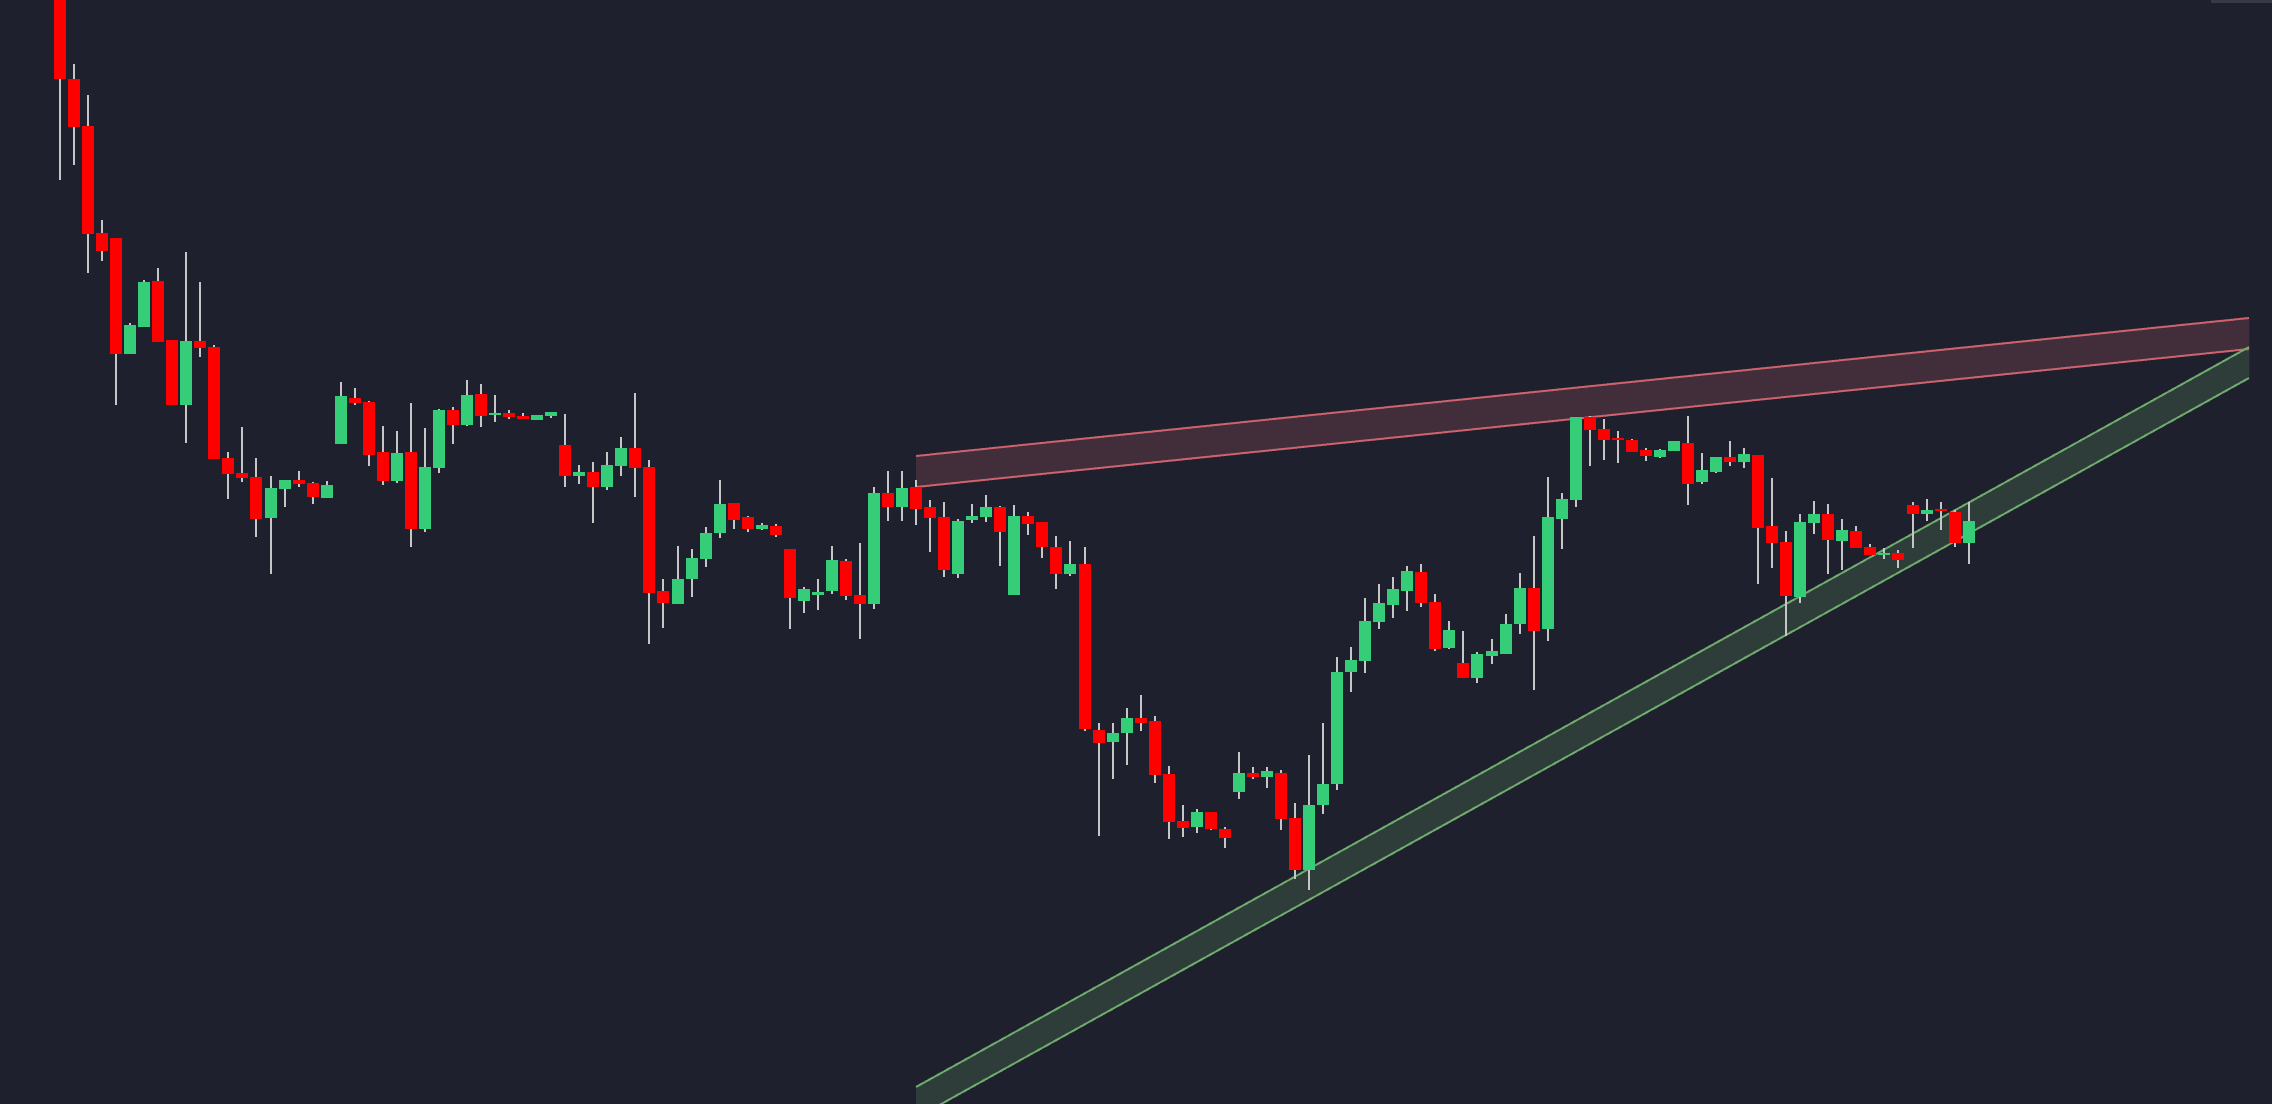
- Ascending Triangle: Bullish pattern with rising support and flat resistance.
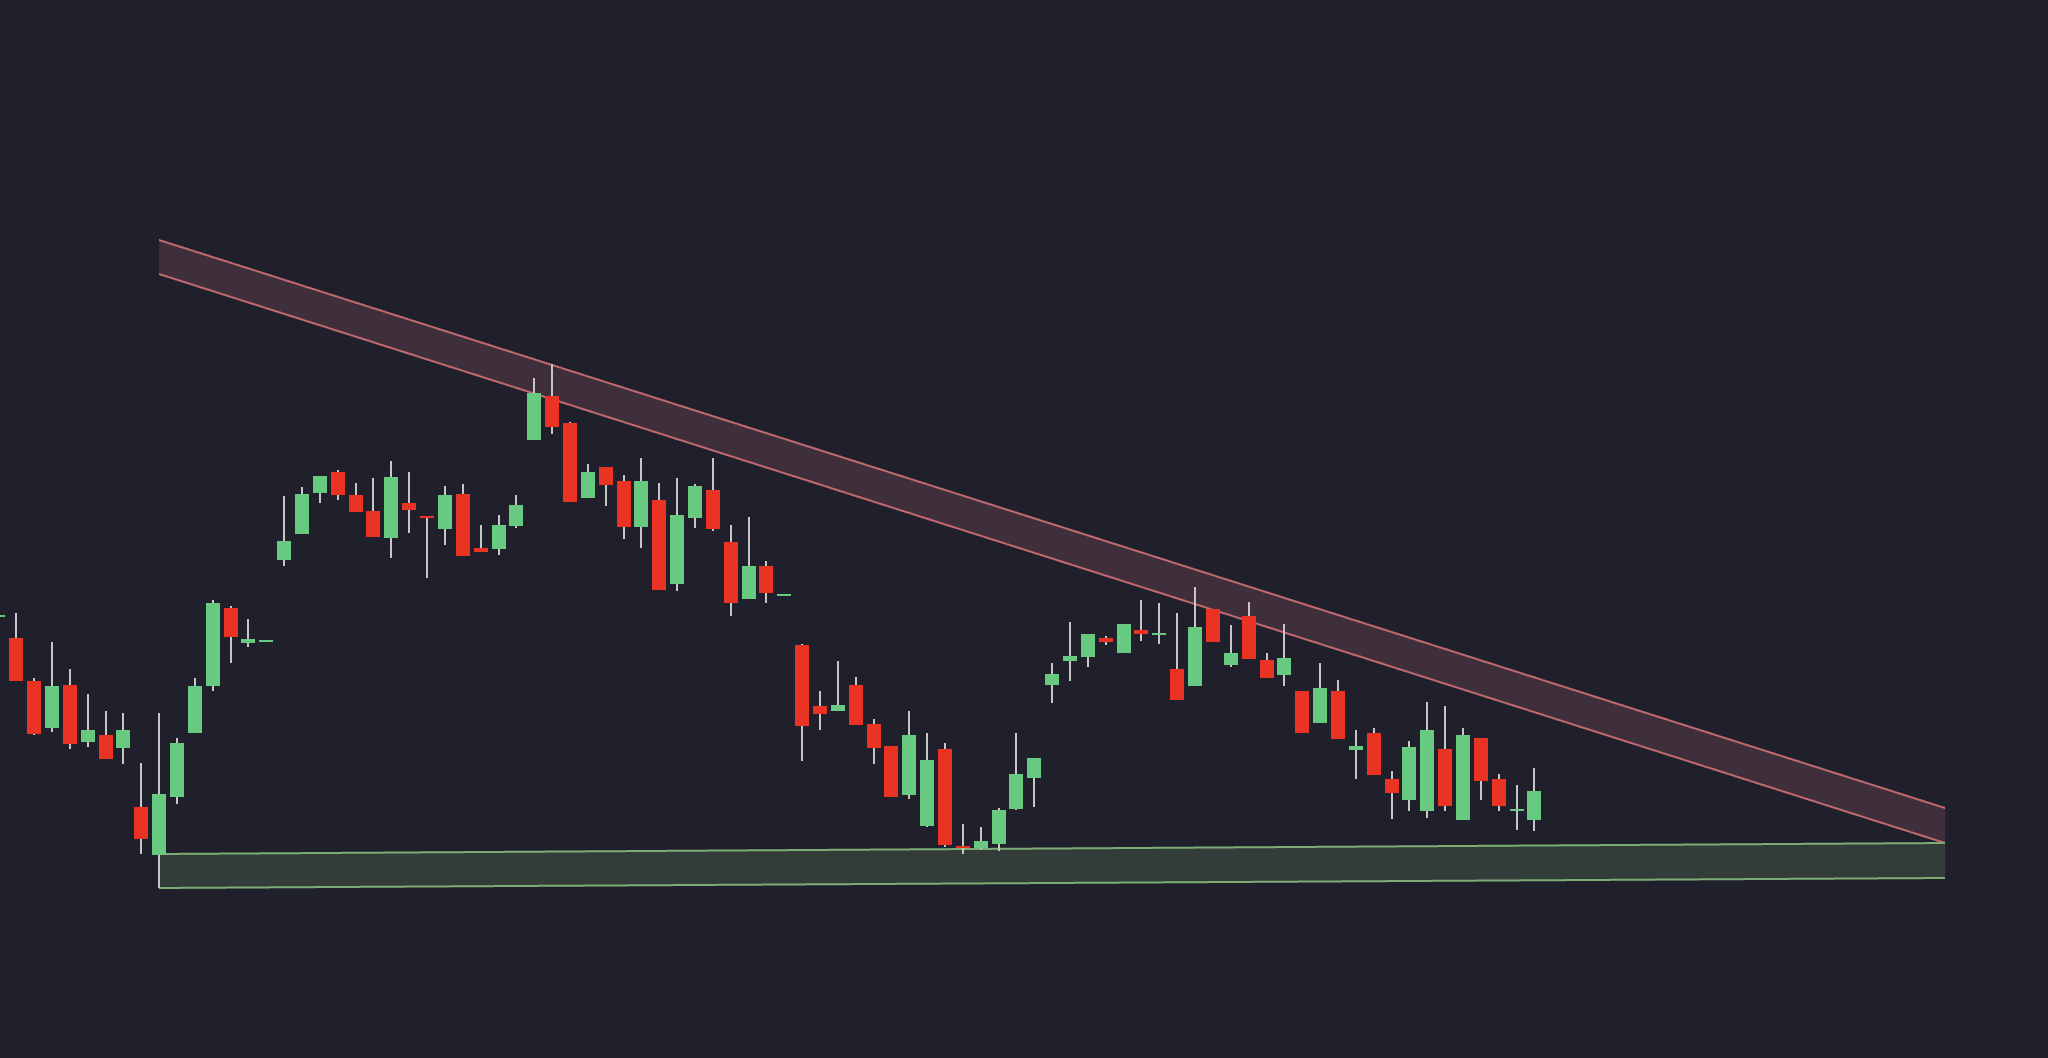
- Descending Triangle: Bearish pattern with falling resistance and flat support.
Quick Overview:
- Ascending Triangles: Signal upward breakouts (64–77% success rate). Look for a strong close above resistance with increased volume.
- Descending Triangles: Signal downward breakdowns. Confirm with a close below support and a volume spike.
- Trade Strategies:
Triangles work across timeframes, but daily charts often yield more reliable signals. Combine patterns with proper risk management for better results.
Ascending Triangles: Upward Price Signals
Pattern Structure
An ascending triangle forms with a horizontal resistance line and a rising support line, signaling growing buying interest. Here’s how its key elements work:
| Component | Description | Why It Matters |
|---|---|---|
| Resistance Line | A flat line connecting equal highs | Shows steady selling pressure |
| Support Line | A rising line connecting higher lows | Indicates increasing buying momentum |
| Volume | Often decreases during the pattern's formation | A volume spike during breakout confirms the move |
| Time Frame | Typically spans 1–3 months | Longer patterns tend to be more reliable |
Upward Breakout Signs
Breakouts in ascending triangles tend to move upward 64–77% of the time. To confirm a breakout, look for:
- A strong close above the resistance level
- A noticeable rise in trading volume during the breakout
- A retest of the previous resistance line, now acting as support
These signals help traders confidently act on potential upward moves.
Market Examples
Traders often use ascending triangles to set up strategic trades. Here’s how:
- Place stop-loss orders just below the most recent low
- Calculate price targets based on the height of the triangle
- Verify the breakout with increasing volume
- Be prepared for throwbacks, as they occur in over 50% of cases
This pattern works well across different timeframes and, when paired with other technical tools, gives traders a solid method for spotting bullish opportunities.
Descending Triangles: Downward Price Signals
Pattern Structure
A descending triangle is a bearish chart pattern made up of two key trendlines: a flat lower trendline acting as support and a descending upper trendline formed by lower highs. Here's a breakdown of its main components:
| Component | Description | Trading Significance |
|---|---|---|
| Support Line | Flat line connecting equal lows | Marks a level where buyers consistently step in |
| Resistance Line | Sloping line connecting lower highs | Shows increasing selling pressure |
| Volume | Usually decreases during the pattern's formation | A volume spike during the breakdown confirms the move |
Downward Breakdown Signs
To confirm a breakdown, look for these signals:
- A decisive close below the support line
- A noticeable increase in trading volume during the breakdown
"A descending triangle is a bearish technical chart pattern formed by a series of lower highs and a flat, lower trendline that acts as support." – Milan Cutkovic, Education
Market Examples
Here are some real-world examples of descending triangles in action:
- Zoom Video Communications (ZM): A descending triangle formed with horizontal support at $66. After multiple tests of this level, the price broke down, accompanied by a surge in volume to confirm the move.
- PayPal Holdings (PYPL): The stock displayed a descending triangle with support at $70. The breakdown was validated by a significant volume increase during the move.
- Currency Market Example: The AUD/USD pair created a descending triangle with support at 0.732 and resistance descending from 0.748. The breakdown triggered a sharp downward move.
Pair these signals with technical indicators for added confidence, and always use strict risk management. For example, placing stop-loss orders slightly above the descending trendline can help guard against false breakdowns.
Triangle Chart Pattern Trading Strategy – Ascending and Descending Patterns
Trading Methods for Triangle Patterns
Trading triangle patterns involves timing your entries and exits while managing risk effectively. Below, you'll find strategies tailored for ascending and descending triangles, building on the pattern signals mentioned earlier.
Ascending Triangle Trade Setup
Here's how to trade an ascending triangle with precision:
| Component | Method |
|---|---|
| Entry Point | Wait for the price to close above the resistance line. |
| Stop Loss | Place your stop loss below the last low within the triangle. |
| Take Profit | Measure the height of the triangle and add it to the breakout level. |
Pair the breakout with a volume spike to confirm its validity. A breakout on low volume could indicate a false move.
Descending Triangle Trade Setup
For descending triangles, focus on clean support breakdowns and proper position sizing:
| Component | Method |
|---|---|
| Entry Trigger | Enter when the price breaks below the horizontal support line. |
| Stop Placement | Place your stop loss just above the descending trendline. |
| Profit Target | Project the triangle's height downward from the breakout point. |
Adding Technical Indicators
Enhance your triangle trading strategies by using technical indicators:
-
Volume Analysis
Look for a volume spike to confirm breakouts. A breakout with low volume might not hold. -
Moving Averages
Use moving averages to confirm trends and identify potential support or resistance levels. -
RSI and MACD
An RSI above 50 can signal strength for upward moves, while MACD momentum helps confirm both upward and downward trends.
These indicators can provide additional confirmation and improve the accuracy of your trades.
Common Mistakes and Advanced Tips
Trading triangle patterns successfully isn't just about spotting the signals. It also requires avoiding common errors and managing your mindset.
Avoiding False Signals
False breakouts can throw off your trades, so it's crucial to confirm signals before jumping in. Use multiple indicators to verify your setup.
Here are some key confirmation methods:
| Confirmation Type | What to Look For |
|---|---|
| Volume Analysis | Look for noticeable volume spikes |
| Price Action | Wait for the second candle close after the breakout |
| Technical Indicators | Check RSI for momentum alignment |
| Volatility Check | Validate with ATR movement |
"The best way to avoid false signals in trading is by using multiple indicators and setting up a trading plan with risk management. You should always cross-reference the data and compare signals between indicators to accurately predict future prices and market movement." – Zeiierman
Chart Time Frame Effects
Longer time frames tend to produce more reliable triangle patterns. For instance, daily and 4-hour charts often provide cleaner setups compared to shorter intraday intervals. Here's how you can approach different time frames:
| Time Frame | Best For |
|---|---|
| Daily Chart | Spotting major patterns and identifying the overall trend |
| 4-Hour Chart | Confirming the pattern and breakout signals |
| 1-Hour Chart | Fine-tuning entry and exit points |
Trading Psychology
Your emotions can make or break a trade. Fear of missing out (FOMO), frustration after a loss, or overthinking your strategy can lead to poor decisions.
"Patience allows you to wait for stronger setups, and discipline prevents you from making decisions based on emotion." – Nina Tsenova
Here are some common psychological pitfalls to watch out for:
- FOMO Trading: Jumping in without proper confirmation.
- Revenge Trading: Taking bigger risks to recover losses.
- Analysis Paralysis: Overcomplicating your decisions by overanalyzing patterns.
To stay on track, set clear entry and exit rules, keep a trading journal, and use demo accounts to practice. Building confidence in your strategy will help you manage these challenges and make better decisions.
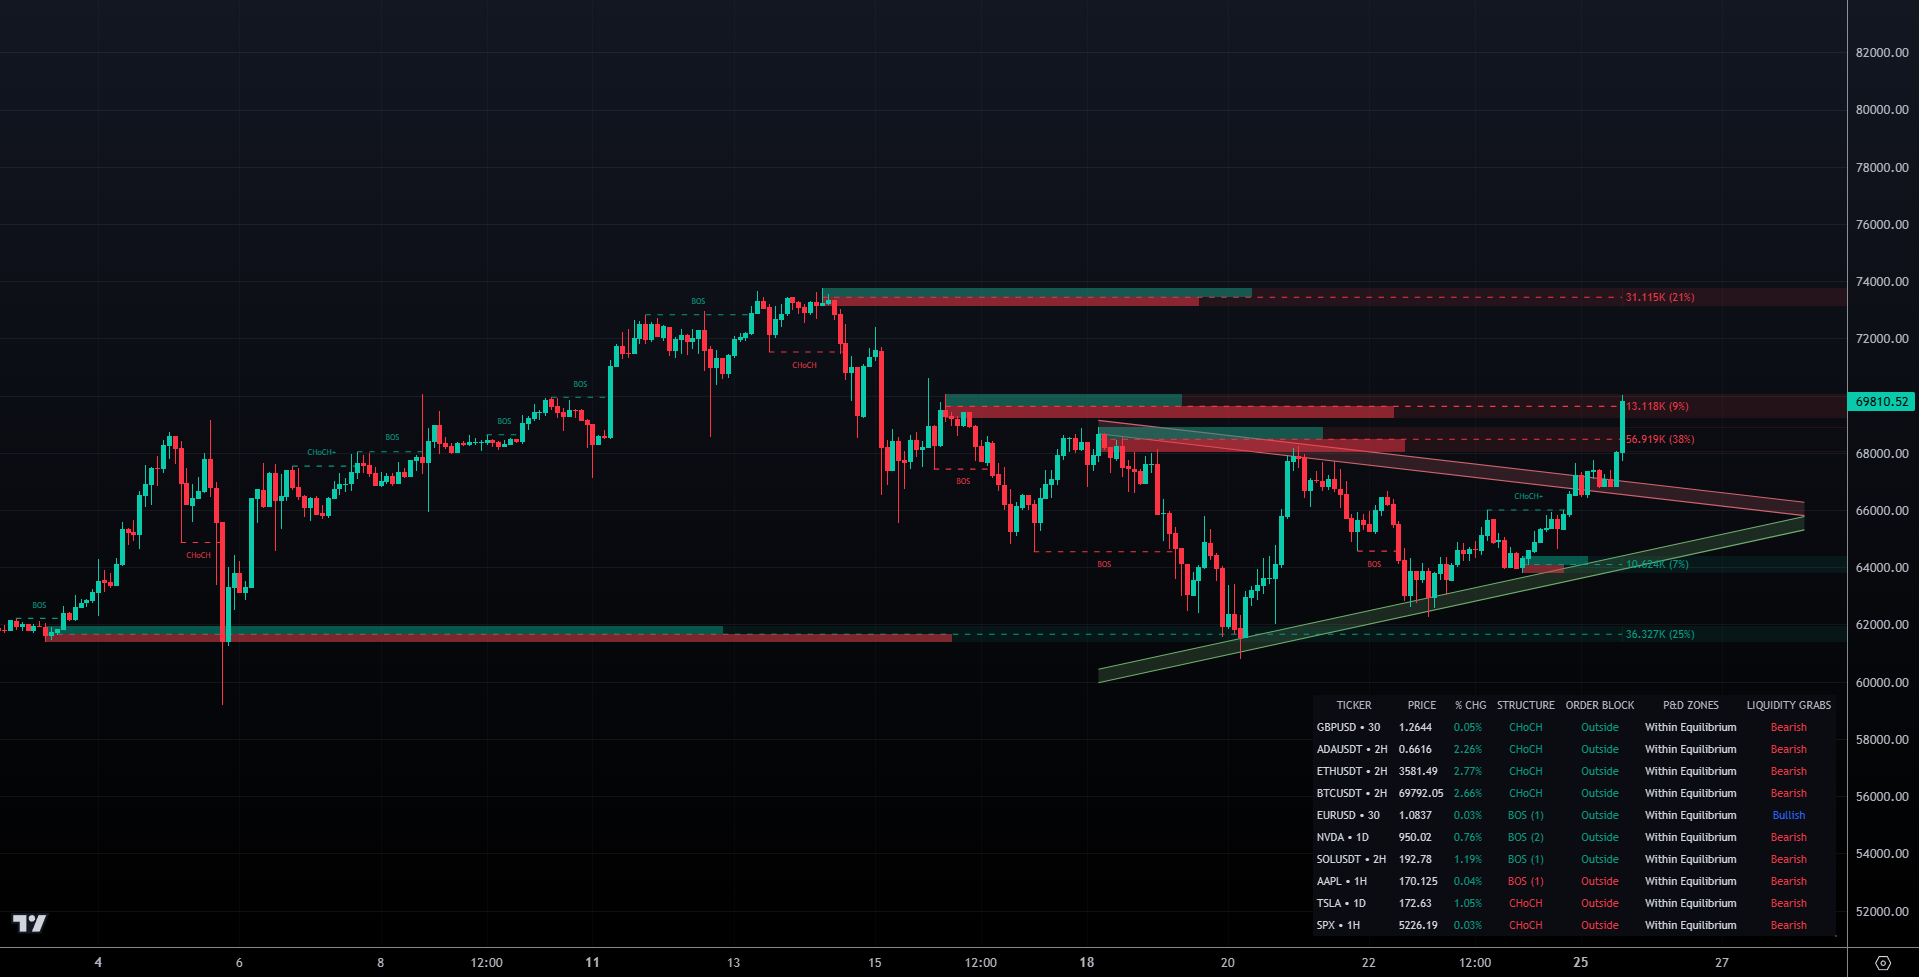
Pattern Detection in the Price Action Concepts Toolkit
LuxAlgo’s Price Action Concepts toolkit automates the identification and plotting of key chart patterns directly on your TradingView charts. It recognizes triangles, head-and-shoulders, double tops and bottoms, and other reversal structures, helping you spot high-probability setups without manual marking. For a full list of supported patterns and detailed behavior, see the documentation.
By leveraging this exclusive toolkit feature, you can reduce chart clutter, save time, and focus on executing trades with greater confidence.
Summary and Action Steps
Main Points Review
Triangle patterns can offer clear entry and exit signals – if you know how to identify them correctly.
Here's how they work:
| Pattern Type | Trading Signals |
|---|---|
| Ascending Triangle | Breakout above resistance with higher trading volume |
| Descending Triangle | Breakdown below support with higher trading volume |
| Confirmation Signs | RSI alignment and validation through price movement |
Getting Started
-
Practice Recognizing Patterns
Spend time analyzing daily charts to identify triangle formations. Use pattern indicators to confirm what you see. -
Develop Your Trading Strategy
- Only enter trades after confirmed breakouts with noticeable volume increases.
- Set stop-loss orders just outside the pattern's boundaries.
- Aim for profits equal to the triangle's height from the breakout point.
-
Start Small with Implementation
Begin with paper trading to track:- The quality of patterns you spot
- Breakout volumes
- Your trade outcomes
- Key lessons from each trade
Although triangle patterns work on any timeframe, daily charts often yield more consistent signals. This makes them a great place to start.


